Why entity matching, exact lines and fixed timestamps matter before AI touches the data.
A billion rows can pass through an AI pipeline and still produce a bad answer. AI cannot rescue a comparison built from different events, lines or timestamps.
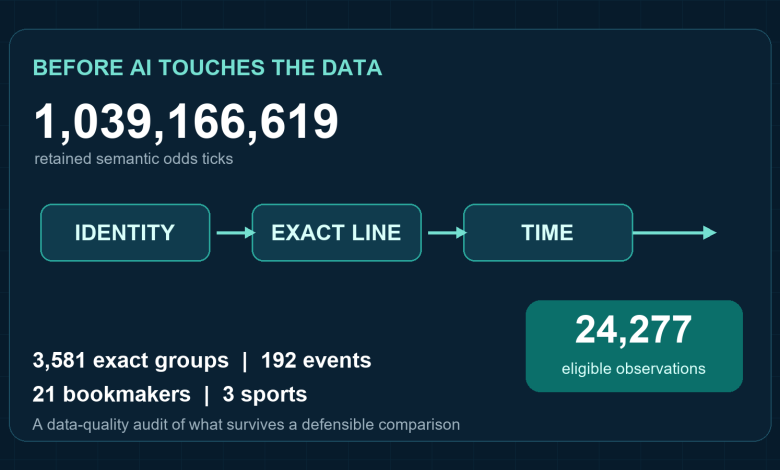
In a recent sportsbook data audit, 1,039,166,619 retained records produced a bounded comparison of 24,277 eligible bookmaker observations. The gap was not a failure. It was the cost of making the data comparable.
Large datasets look convincing because the headline number is easy to understand. In practice, scale often brings more aliases, duplicate states, stale records and plausible-looking mistakes.
The billion-row number needed a boundary
The retained source universe covered 82 days, from 18 January to 9 April 2026. It contained 25 bookmaker names, seven sports, 60 leagues and 2,913 events.
The analytical study was deliberately narrower. It used eligible events from 17 to 22 February and reconstructed 3,581 exact comparison groups across 192 events, 21 bookmakers and three sports.
| Measure | Retained source universe | Bounded comparison |
| Records or observations | 1,039,166,619 | 24,277 |
| Bookmaker names | 25 | 21 matched bookmakers |
| Sports | 7 | 3 |
| Events | 2,913 | 192 |
| Exact comparison groups | – | 3,581 |
Source: WagerWise Sportsbook Data-Engineering Study (2026).
Those scopes cannot be quietly blended together. The study audited a billion-row source universe, but it did not claim that a billion prices entered the final comparison.
Event, line and time all had to match
A sportsbook feed rarely arrives as one clean table. Event names change, teams use aliases, markets are labelled differently and the same operator can appear under several names or technical feeds.
“Manchester United” and “Man Utd” are easy for a person to recognise. A machine still needs one canonical identity. The same problem applies to events, competitions, market groups and individual selections.
The comparison required the same canonical event, market, selection and pre-match status. Missing event, market or selection identifiers were rejected rather than guessed.
This matters for AI systems because a model can make a broken join sound reasonable. It cannot turn two different events into the same event just because their names look close.
Numeric lines created another trap. A price of 1.95 on a team at +3.5 is not comparable with 2.00 at +4.5 because the prices describe different products.
The same applies to a game total of 210.5 versus 211.5. Treating them as equivalent can manufacture a false price gap or a winner that never existed.
Every eligible group therefore required the same exact line. That rule eliminates an entire class of convincing but false comparisons.
Time required the same discipline. Comparing one operator at midday with another five minutes before the event says little about either one.
The study reconstructed displayed prices at 24 hours, six hours, one hour and 10 minutes before scheduled commencement. One hour was the primary comparison horizon.
For each checkpoint, the process selected the latest valid semantic price or availability state at or before the target. Post-start records were excluded, and every comparison group required at least five distinct bookmakers.
Snapshot age was not treated as platform latency. A stored state shows when the latest qualifying change was observed; it does not prove how quickly an operator reacted to the market.
Raw leaderboards rewarded narrow coverage
Once the matching was complete, 21 bookmakers appeared in eligible comparisons. Only four qualified for the broad overall ranking.
Qualification required at least 1,000 comparisons, two sports, 50 events and 10% coverage of the eligible universe. Concentration caps also stopped one sport, league or market from dominating an operator’s result.
Without those controls, a narrow feed could look unbeatable. One operator recorded a raw best-price rate of 53.1%, yet covered only 35.5% of the eligible universe and drew 96.6% of its observations from one sport.
Among the four broad-coverage qualifiers, the observed leader held the best price in 17.7% of equal-sport comparisons. Its 95% event-cluster bootstrap interval ran from 15.0% to 20.3%.
Even the qualified leader was best fewer than one time in five. No bookmaker led every sport, market and horizon.
Coverage was not a useful shortcut for price strength either. Coverage and raw best-price rate had a correlation of just 0.08.
Ties also changed the ranking logic. Of the 3,581 exact groups, 2,302 produced one unique best price, 873 produced a two-way tie and 406 produced a tie between three or more bookmakers.
That left 35.7% of groups tied. Fractional credit stopped one tied result from being counted as several full wins.
The checks mattered as much as the result
The automated quality checks found zero duplicate odds records after horizon selection, zero duplicate bookmakers within groups, zero invalid decimal prices and zero post-start records. They also found no missing canonical event, market or selection identifiers in the final sample.
Automation did not get the last word. A separate rule flagged 112 cases where the leading price was at least 25% above the second-best price for manual review.
The study included a deterministic validation sample containing every bookmaker observation from 200 exact comparison groups. Alternative raw, equal-event and equal-market weightings tested whether the results depended on one design choice.
There was also a measurable financial consequence to getting the comparison right. Across eligible observations, choosing the strongest displayed quote increased the gross return on a winning A$100 wager by an average of A$20.31 compared with taking the observed bookmaker price.
That figure is not expected value or realised profit. It is a difference in gross payout on winning wagers, and nothing more.
The study did not record accepted stakes, account restrictions, geographic availability or whether every quoted price could accept the same wager. Player props, racing, futures, novelty markets and same-game multis were outside its scope.
Five rules for AI teams working with large datasets
AI can help map aliases, detect unusual records and propose likely matches. It can also scale the same mistake across a billion rows with impressive confidence.
Five rules matter more than the model name:
Separate the source universe from the analytical sample. A large archive is not the same thing as the rows used in a result.
Resolve entities before calculating anything. Similar names are not proof of shared identity.
Treat numeric and temporal fields as part of identity. A changed line or timestamp can create a different product.
Publish qualification rules before publishing rankings. Otherwise, narrow samples can appear dominant.
State what the data cannot prove. A clear limit is more credible than an inflated conclusion.
Clean inputs do not guarantee a useful conclusion. Dirty joins almost guarantee a bad one.
The real work starts before the model
The useful result was not that one bookmaker occasionally displayed a stronger price. It was that the apparent answer changed when identity, coverage, concentration and time were handled properly.
That lesson extends well beyond sports data. A model can classify, summarise and rank whatever it receives, but it cannot fix a comparison whose basic units were never equivalent.
The hard part of large-scale analysis is rarely collecting another million rows. It is proving that the rows already collected mean the same thing.