
An AI-generated dashboard becomes useful to a SaaS business when someone can maintain it, explain its numbers and safely deliver it to customers. A convincing first screen is only the start. The more consequential question is what the tool leaves behind: source files, a reusable report, a hosted workbook or a conversation that disappears.
Embeddable is our best overall choice for engineering-led SaaS teams building custom customer dashboards with AI assistance. Its combination of reviewable dashboard files, custom components and a managed analytics runtime fits that particular job. Holistics is compelling for analytics engineering, Luzmo for visual authoring, and several broader BI platforms make sense when you already use their models.
What counts as an AI dashboard builder
Each option has a documented AI-assisted route to creating reusable analytical content and a customer delivery route. We compared the generated artifact, human review, metric preparation and deployment responsibilities. Some tools generate a complete dashboard; others help build the components of one. Beta features are identified below.
This is a documentation-based editorial comparison, not a timed generation test. Disclosure: The article was prepared as part of an Embeddable-focused content project. The overall recommendation is scoped to the engineering-led use case above.
Compare what you will maintain
| Platform | AI authoring output | Main review focus |
|---|---|---|
| Embeddable | Dashboard YAML and related code | Bindings, components and release |
| Holistics | Analytics models and dashboards | AML changes and shared definitions |
| GoodData | Metrics and analytics configuration | Workspace scope and deployment effects |
| Luzmo | Reusable dashboard configuration | Datasets, filters and persistence |
| Omni | Queries, visualizations and dashboards | Chosen fields and calculations |
| Cube | Commercial workbooks and dashboards | Semantic model and authoring permissions |
| ThoughtSpot | Liveboards | Answers, filters and narrative selection |
| Power BI | Report pages | Semantic model and supported visuals |
| Sigma | Workbooks and app elements | Beta behavior and permitted actions |
| Hex | Code-generated analytical apps | Notebook logic and beta limitations |
1 Embeddable for reviewable customer dashboard code
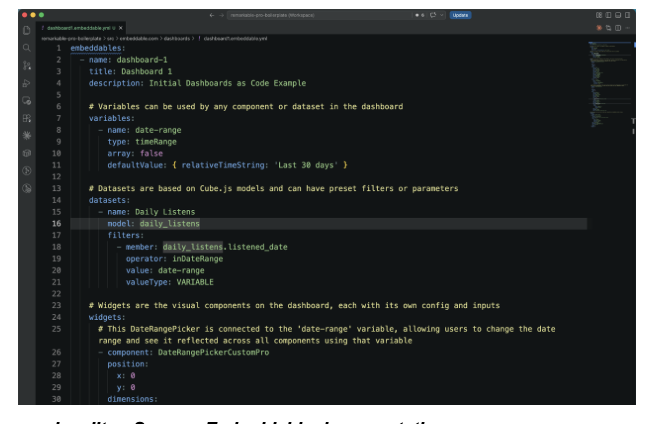
Dashboard YAML in a code editor. Source: Embeddable documentation.
Embeddable’s AI dashboard workflow uses a supplied skill to work with the models and components in your repository. The output is an ordinary .embeddable.yml file, so an engineer can inspect the change and preview the dashboard before pushing and publishing.
This is a strong fit when product-specific UI and code review are central requirements. The supplied skill is discovered automatically by Claude Code; other coding agents can use the guidance when directed to it.
You still own the meaning of the data and the release decision. This developer workflow is separate from Embeddable’s end-user AI Chatbot, which its documentation currently labels Prototype.
2 Holistics for an analytics engineering workflow
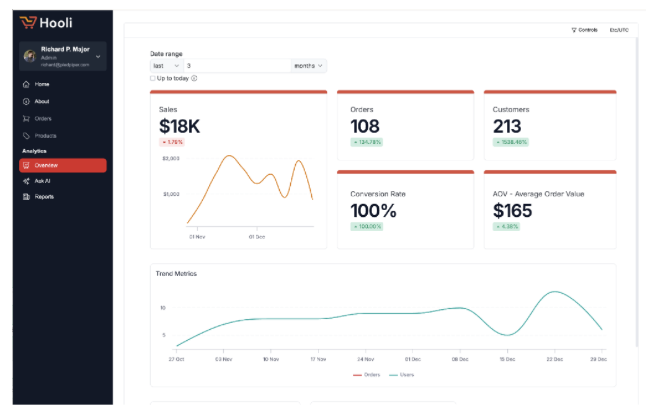
Analytics development example. Source: Holistics documentation.
Holistics supports AI development through its browser-based Development Copilot and local coding agents. Models, metrics and dashboards remain part of an analytics project expressed in AML.
That is attractive when the person reviewing the generated dashboard also owns the semantic model. A request to add a metric can be assessed alongside the definition that will power it, rather than treated as an isolated chart edit.
Customer delivery still needs an embedding implementation and permissions. Evaluate the authoring workflow with a realistic model change, then check the resulting dashboard through the customer-facing portal. A correct development preview does not establish the behavior of every embedded user role.
3 GoodData for governed authoring through an agent
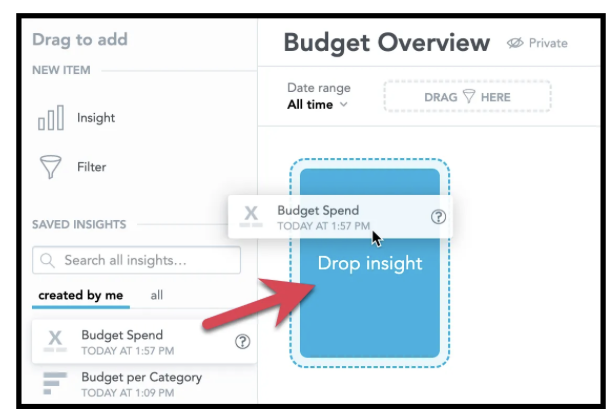
Adding a saved visualization to a dashboard. Source: GoodData documentation. This image shows dashboard assembly, not an AI test.
GoodData’s MCP server exposes analytics metadata and authoring capabilities to compatible agents. It can support work on metrics, visualizations and the broader analytics model while retaining GoodData’s workspace and permission structure.
The important detail is mutation scope. Its deploy_workspace_analytics operation replaces the existing analytics model in a workspace. An instruction that sounds like a small edit can therefore require reviewing a much larger payload.
Use a development workspace and inspect the complete intended change. GoodData is particularly relevant when the dashboard is one part of a governed analytical product, but giving an agent tools does not make every deployment safe to accept automatically.
4 Luzmo for a dashboard authors can refine visually
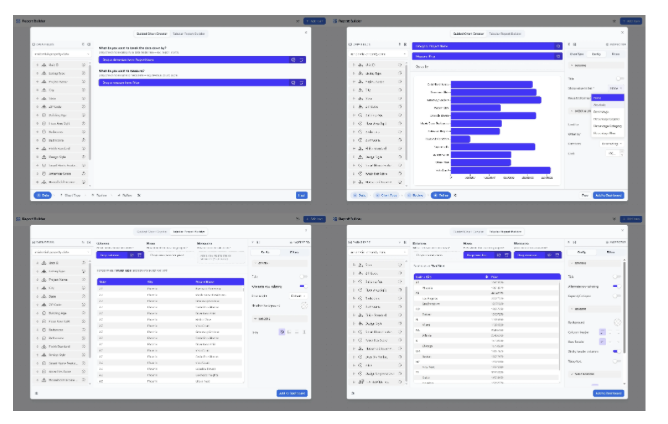
Composable builder example. Source: Luzmo. AI generation and visual editing are separate stages of the authoring workflow.
Luzmo’s Dashboard Agent can generate and edit reusable dashboards in Studio and the updated Embedded Dashboard Editor. Its API route separates generating a dashboard from persisting it, an important distinction for automated onboarding.
This fits teams that want a first layout from a prompt and then expect authors to adjust charts, filters and labels visually. Specify the intended dataset and metric rules before asking for the layout.
Confirm the relevant editor version and feature configuration. Dashboard Agent should also be distinguished from Luzmo IQ, which supports data questions, and AI Summary, which describes existing dashboard content. They solve different tasks.
5 Omni for turning exploration into a dashboard
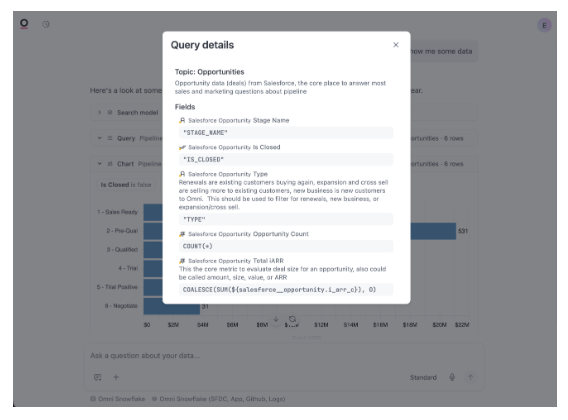
Inspecting the fields behind an AI query. Source: Omni documentation.
Omni Agent can create queries and visualizations, then assemble dashboards from the conversation. Its query details help an author examine the fields and calculations behind the answer before saving the result.
This suits a product team that begins with an analytical question rather than an exact layout specification. It also offers a useful review point: confirm the query, then decide whether its chart belongs in a shared dashboard.
Be precise about the AI surface. Published dashboard chat is not interchangeable with the authoring agent. Check the required permissions and whether the intended customer can create, edit or merely explore the resulting content.
6 Cube for authoring on a shared semantic foundation
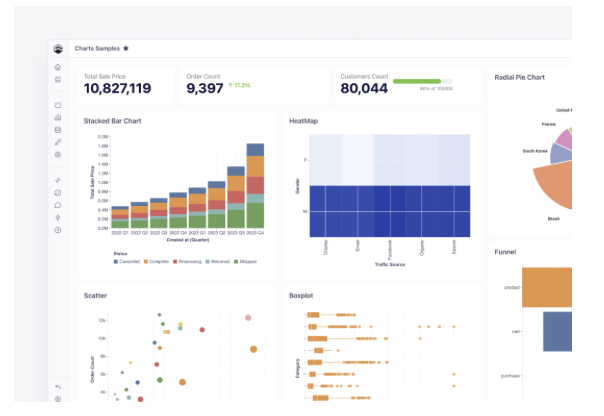
Dashboard example published by Cube. Source: Cube. The image illustrates dashboard output.
The current commercial Cube platform includes workbooks, dashboards and Creator Mode, with AI authoring controls. This is broader than deploying open-source Cube Core as a data API behind your own charts.
Cube is relevant when reusable metric definitions must serve customer dashboards and other consumers. Decide whether the final experience will use the commercial authoring interface, an embedded surface or a custom frontend.
Creator Mode’s session settings distinguish AI access from workspace authoring and visibility controls. Review those permissions alongside the generated content. A hidden chat button is not, by itself, a server-side denial of AI access or the ability to create content.
7 ThoughtSpot for AI assembled Liveboards
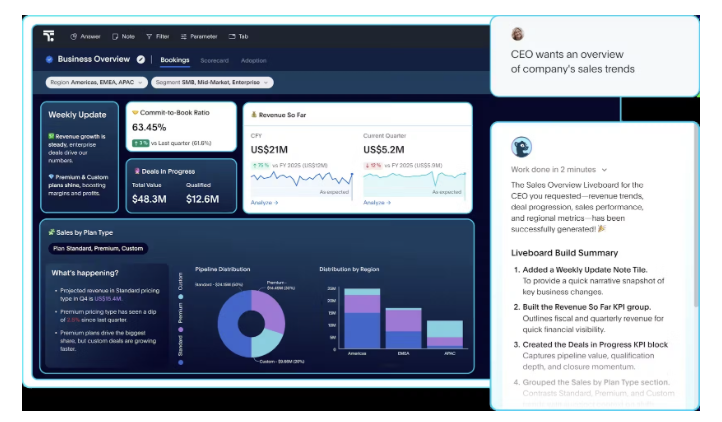
SpotterViz and the resulting Liveboard in a vendor-published example. Source: ThoughtSpot.
ThoughtSpot’s SpotterViz creates Liveboards through natural-language authoring. A Liveboard collects analytical answers into a reusable presentation, making it useful when the challenge is selecting and organizing the right analyses.
For a SaaS team, this can work well when the desired customer experience combines recurring dashboards with further exploration. ThoughtSpot also provides embedded delivery tools.
Review which questions the agent chose to answer and which it omitted. An attractive narrative can overemphasize available data while missing the decision the dashboard should support. Confirm the required embedded AI capabilities separately from the internal authoring experience; this article does not measure generation speed.
8 Power BI for teams already authoring Microsoft reports
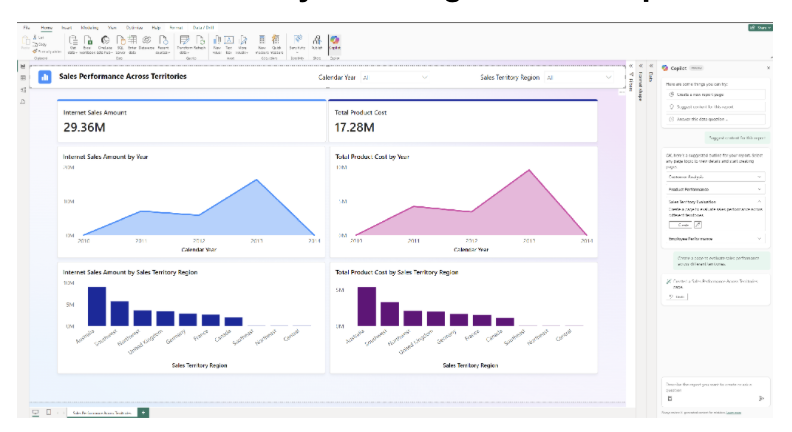
Report authoring with Copilot. Source: Microsoft documentation.
Copilot can create and edit report pages in Power BI Desktop or the service. The result remains a Power BI report backed by its semantic model, which suits teams already maintaining that reporting stack.
The authoring limits matter. Microsoft’s documentation lists unsupported custom visuals and styling changes, among other restrictions. Plan for manual refinement if your product needs those elements.
Separate the authoring license and capacity requirements from external app-owns-data delivery. A report built with Copilot does not prove that customers can use Copilot within its embed. Validate the intended deployment instead of treating “AI generated” as a statement about the final customer interface.
9 Sigma for workbook and app building
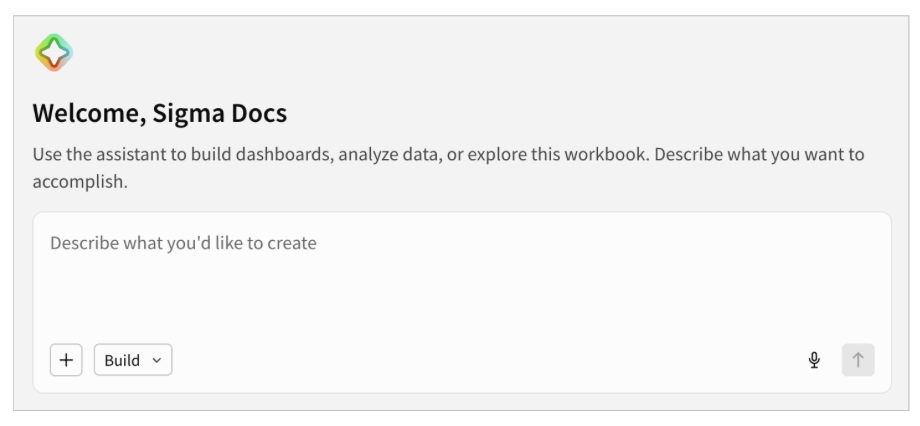
Assistant in Build mode. Source: Sigma documentation. This authoring feature is in beta.
Sigma Assistant’s plan and build modes can create and modify workbook elements, including charts, tables, controls and actions. The feature is in public beta and requires a configured AI provider and appropriate permissions.
It is particularly interesting when a dashboard forms part of a broader operational workflow. Generated actions and inputs deserve closer review than a read-only chart because they can change what a user does next.
Use a restricted development role and inspect the proposed workbook behavior. Confirm beta access and support expectations, then validate the customer embed independently. Existing Sigma expertise is a stronger reason to shortlist it than a generic promise of instant app creation.
10 Hex for custom analytical applications
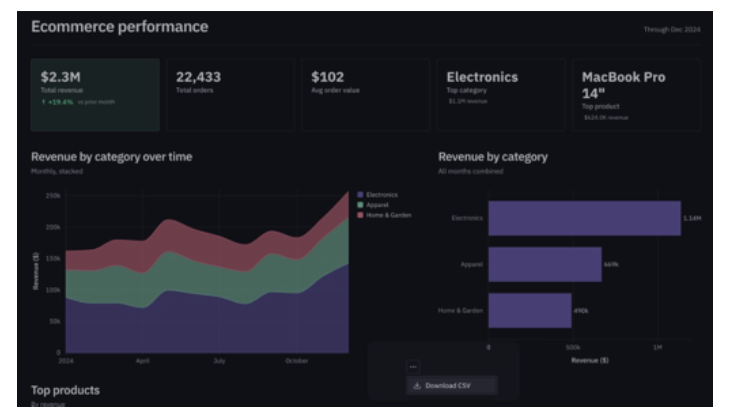
Generative app example with chart export controls. Source: Hex documentation. Generative apps are in beta.
Hex Generative apps create a custom interface from a project’s notebook data. Authors can inspect and edit the generated files, giving the workflow more flexibility than a fixed dashboard grid.
Hex also documents signed embedding for external delivery. Its user attributes must be incorporated into the application’s row-level filtering logic; sending an attribute alone does not secure the underlying analysis.
The app type is in beta and lacks some Classic app features, including saved views and PDF export. It is a qualified option for custom data applications when those limits are acceptable. Check the signed embedding requirements before treating a shared prototype as a customer-ready product.
A useful authoring trial
Give each finalist the same dataset, a written metric definition and a dashboard task. For example: show active accounts over time, usage by plan and accounts whose activity declined. Define “active,” the reporting timezone and the comparison period before generation. This is a proposed trial, not a benchmark we have run.
Keep the first output and the human corrections. Record whether the tool invented a field, used the wrong grain, selected misleading chart scales or ignored a filter requirement. Count the work needed to reach an accepted result, rather than celebrating the first render.
Then change a metric definition and ask another engineer or analyst to maintain the dashboard. They should be able to identify the generated artifact, understand its dependencies and release the change without restarting the conversation from scratch.
For customer delivery, use two tenant identities, a deliberately empty dataset and a failed-query case. Verify access, loading behavior, saved state and recovery. In Embeddable, the dashboard code workflow makes the authored configuration inspectable; application authorization and release checks still need deliberate implementation.
Choose the tool whose output your team can confidently own. AI assistance is valuable when it reduces the path to a correct, maintainable dashboard, not merely the time until something appears on screen.