You built the agent. It works in testing. Then it hits production and starts giving wrong answers, timing out, or burning through your token budget, and you have no idea why.
This is when developers discover that print statements and log files weren’t built for this. LLM applications fail in ways traditional tooling can’t see. A hallucination doesn’t throw an exception. A slow retrieval step doesn’t show up in CPU metrics. A prompt that worked yesterday silently degrades today.
The fix is observability. And the standard for doing it right is OpenTelemetry.
What OpenTelemetry actually is
OpenTelemetry (OTel) is not a monitoring product. It’s a vendor-neutral specification under the CNCF that defines a standard way to collect observability data: what gets collected, what it’s called, how it gets shipped. You instrument your application once and can send that data to Grafana, Datadog, Jaeger, or a purpose-built LLM platform without rewriting your instrumentation.
That portability matters more than people realize early on. Your observability investment is in your instrumentation code, not in the backend you happen to be using today.
The semantic conventions problem nobody talks about
Every LLM observability platform claims OTel compatibility. Technically, most are: they’ll accept an OTLP payload without crashing. But protocol-level compatibility says nothing about whether your spans will actually mean anything on the other side.
The problem is semantic conventions. OTel defines how to send data but doesn’t fully define what to name LLM-specific attributes. Three competing standards have emerged: OTel’s own GenAI conventions (still evolving, not fully ratified), Arize’s OpenInference conventions (used by LlamaIndex, structurally different), and whatever each vendor decided to call things before any standard existed.
In practice, this means your LlamaIndex pipeline emits OpenInference, your custom LLM wrapper emits GenAI conventions, and your framework’s built-in tracing emits something proprietary. All three land as valid OTLP. None use the same attribute names. Your token usage dashboard is reading three different fields depending on which span it hits.
This is the real state of LLM observability tooling in 2026. The protocol works. The conventions are a mess. And it mirrors what happened with APM a decade ago: fragmentation precedes consolidation. The difference is that the LLM space is moving faster, and teams that pick a coherent instrumentation strategy now will avoid painful migrations later.
Why traces matter more than logs for LLM work
OTel has three pillars: logs, metrics, and traces. For LLM applications, traces do the heavy lifting.
A log is fire-and-forget. Something happened, you write a line. No duration, no parent-child relationship, no shared context. Metrics tell you something is wrong but not what exactly went wrong with request #a7b3c9 at 2:32pm.
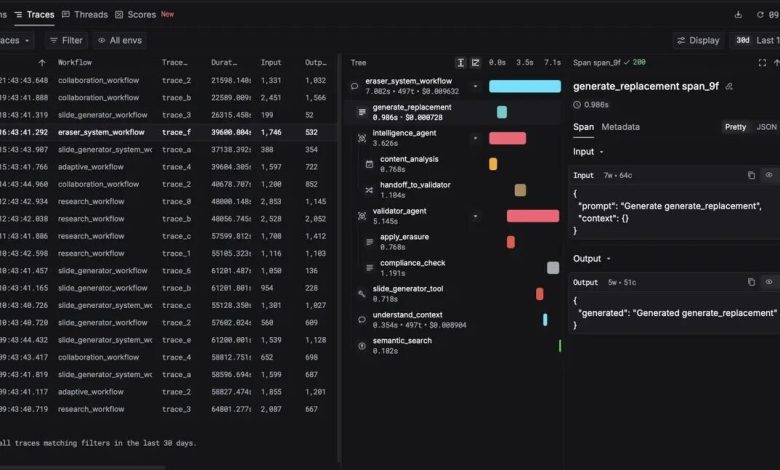
A trace represents the complete lifecycle of a single request. Inside that trace are spans, each wrapping one unit of work with a start time, end time, attributes, and a known relationship to other spans:
Trace: user_query [total: 1.2s]
├── Span: routing [12ms]
│ └── router.model=gpt-4o-mini, routing.result=rag
├── Span: retrieval [180ms]
│ └── retrieval.doc_count=5, retrieval.top_score=0.87
├── Span: llm.completion [890ms]
│ └── llm.model=gpt-4o, llm.tokens.prompt=1240, llm.cost_usd=0.0094
└── Span: post_processing [8ms]
You see exactly where time went, what each step cost, and what decisions were made. When a user reports a wrong answer, you pull up the trace, already assembled, already timed, already attributed. No grepping through log files trying to reconstruct a sequence.
One trend worth calling out: as model providers add more built-in capabilities (function calling, structured outputs, vision), the surface area of what needs to be traced per request keeps expanding. Teams that treat observability as an afterthought are accumulating blind spots faster than they realize.
What makes agents especially hard to observe
Simple chat completions are easy. One request, one LLM call, one response. Agents are different. An agent might route to one of several tools, loop multiple times before settling on an answer, run subtasks in parallel, or hand off to another agent. Each step is a span, and several things break naive approaches:
Context propagation across tool calls requires trace IDs to travel with outgoing requests. Multi-agent traces need explicit context passing across agent boundaries, which most frameworks don’t do automatically. Loops need clearly labeled iterations, not identical span names you untangle manually. Routing decisions should be recorded as attributes so you can see why the agent chose RAG over a direct LLM call.
One useful mental model is representing agents as state machines where each state transition is a span. This makes control flow visible in the trace rather than implied by span ordering. If you can see the states an agent moved through, debugging a wrong decision gets tractable.
This also reflects something happening across the industry: as agent architectures grow more complex (multi-agent orchestration, dynamic tool selection, self-correction loops), the gap between “it ran” and “I understand what it did” keeps widening. Observability isn’t just debugging infrastructure anymore. It’s becoming the feedback loop that teams use to actually improve agent behavior over time.
What it looks like when it works
A user reports your research agent gave outdated information. With traces, you open the specific request and see the retrieval step returned documents from 2023, the LLM generated a confident response from stale content, and no error was thrown because technically nothing failed. A warning event flagged that content age exceeded a threshold.
This is the class of failure that defines LLM observability: silent quality problems rather than system errors. The trace caught it because instrumentation measured content age and flagged it. That’s the difference between finding the problem in a trace and having a user report it three days later.
Where is this all heading
The LLM observability space is still early, but a few directions are becoming clear.
First, evaluation and observability are converging. Today most teams treat evals as a CI/CD concern and observability as a production concern. But the same trace data that helps you debug a bad response can also feed automated quality scoring in production. Teams that connect these two loops will iterate faster than those running them separately.
Second, cost observability is becoming a first-class requirement, not an afterthought. As teams scale from prototypes to production workloads with thousands of daily requests across multiple models, understanding cost per request, per feature, and per user segment is table stakes. Token-level attribution across a multi-step pipeline is something most teams currently do in spreadsheets. It belongs in the trace.
Third, the tooling will consolidate. Right now the space has dozens of startups, several open source projects, and the major APM vendors all building LLM-specific features. History says this shakes out to a few winners within two to three years. The teams that instrument on OTel now, regardless of which backend they pick, will be the ones who navigate that consolidation without pain.
The bottom line: OpenTelemetry is the right foundation because it’s vendor-neutral and you instrument once. But OTel is infrastructure. What matters is what you build on top of it: the semantic understanding of token costs, the alerting that knows when retrieval quality degrades, the trace view that makes an agent’s decision-making visible. If you’re moving past simple chat completions into agents and RAG, the observability requirements go up fast. Traces are how you keep up.
—-
About the Author
Frank Chen is the Head of Developer Relations at Respan. He built Respan’s CLI, MCP server, and SDK instrumentation layer, enabling seamless integration with AI frameworks and drives developer adoption through technical content. Before Respan, Frank was an Electrical Engineer on the STCE team at Samsara, where he designed the next generation of asset tags and optimized power consumption for production hardware.