Data from 250+ integrations across thousands of commercial buildings offers a clearer view than most market surveys of what owners are actually deploying.
The smart building industry has a credibility problem. For years, the market has talked about autonomous buildings, AI-driven infrastructure, and intelligent operations.
Meanwhile, most commercial assets still operate as fragmented collections of systems that barely understand each other. CFOs want efficiency. Operations teams want visibility. Vendors keep adding more software. The result is often more complexity, not less.
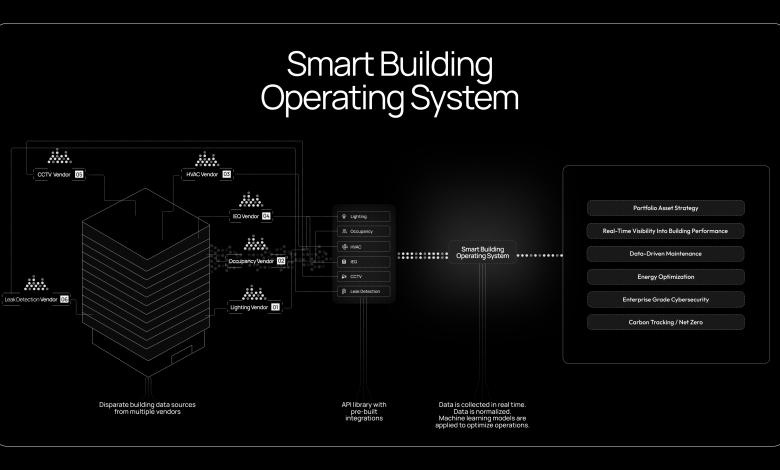
The average Class A office is utilizing 12 or more technology systems from different vendors, running on different protocols, generating data in formats that don’t talk to each other.
The gap between how the industry talks about buildings and how buildings actually operate is still massive. But the integration layer exposes reality pretty quickly. Once you sit across enough portfolios, patterns start becoming impossible to ignore.
Data from KODE Labs, drawn from over 250+ integrations across thousands of commercial buildings, offers a ground-level view of the eight building technology categories owners are actually connecting to, in what order, and why.
BAS/HVAC leads the list, followed by metering, occupancy, indoor environmental quality (IEQ), work order management, access control, leak detection, and lighting.
‘Energy’ and ‘Cost’ sit at the top—for obvious reasons
The ordering is not arbitrary. It closely tracks the three pressure points currently defining commercial real estate (CRE): cost control, compliance exposure, and tenant retention. Read it that way, and this stack becomes an ordered snapshot taken directly from a building owner’s strategy document.
BAS/HVAC tops global deployment rankings.
This is not surprising. Building Automation Systems are the operational backbone of any commercial asset, governing climate control, HVAC scheduling, and the energy consumption that follows from both.
For most building owners, HVAC accounts for the single largest share of operational expenditure. Visibility over what’s being spent isn’t optional. The protocols involvedand a range of proprietary controllers—vary widely by asset age and geography.
This is why the operational layer matters. Portfolio-wide visibility doesn’t come from adding more dashboards. It comes from normalizing fragmented systems into a single operational layer that understands buildings holistically.
Without that layer, engineers are still jumping between disconnected interfaces, manually correlating systems that were never designed to work together. At portfolio scale, that fragmentation becomes operational drag.
Metering comes second.
The reason is increasingly regulatory, rather than purely operational. Energy management has always been a cost lever, but utility data is now central to carbon accounting, ESG reporting, and compliance.
With 26 metering integrations spanning energy, water, gas, and solar submetering, the category covers effectively any utility data source a building is likely to run.
Institutional owners do not need partial visibility, but operational consistency across entire portfolios.
This becomes impossible when every building operates as its own disconnected stack with different data structures, workflows, and reporting layers. The operational challenge is no longer collecting data. It’s creating consistency across fragmented systems.
Utilization data has moved from insight to operational requirement
Occupancy ranks third.
Five years ago, people-counting sensors were largely a post-occupancy evaluation tool—useful for understanding space usage in retrospect, but rarely integrated into live building operations.
The post-pandemic return-to-office process changed that. Building owners now need real-time occupancy data to drive demand-controlled ventilation, manage cleaning schedules, justify space reconfiguration decisions, and demonstrate utilization metrics to occupiers renegotiating leases.
The vendor proliferation in this category is substantial. The deployment data covers 25 different occupancy sensor vendors. That figure reflects a market that hasn’t consolidated—building owners are using varyingsensor technologies across different floors, assets, and geographies.
If a platform can only read from a subset of those vendors, utilization data becomes incomplete: owners risk making space, leasing, and operational decisions from a distorted picture.
Indoor Environmental Quality (IEQ) is found at four.
Indoor air quality monitoring—CO2, PM2.5, VOCs, temperature, humidity—has moved steadily up the priority list since 2020. WELL certification demand is part of the story; so is occupier pressure on landlords to demonstrate that the office environment is actively managed.
The dataset pulls IEQ data from 18 different sensor systems into a single, unified view. The use case here isn’t just wellness optics, however, but operationally focused: CO2 levels drive ventilation decisions, which affect energy consumption, which in turn feeds back into the metering and BAS layers.
The building stack is no longer a collection of independent systems. Occupancy affects ventilation. Ventilation affects energy.
Energy affects carbon exposure and operating cost. Buildings are already operating as interconnected systems. Most software stacks simply weren’t designed to understand them that way.
‘Operations’ and ‘Risk’ close the loop
Work Order Management places fifth.
This represents the point where data becomes action. Detecting a fault is one thing. Getting a technician dispatched against it through a connected maintenance workflow is another.
Eleven work order integrations—covering CMMS platforms and service dispatch systems—close that loop.
The alternative is what most buildings still do: fault alerts surface in one system, maintenance requests get raised manually in another, and the resolution timeline stretches because the handoff is human rather than automated.
Access control comes in sixth.
This is a non-negotiable for enterprise tenants: security infrastructure that integrates with, rather than sits alongside, broader building operations.
Thirteen access control integrations in the dataset allow security data to be overlaid with occupancy and HVAC—enabling coordinated building responses.
An empty floor should not be conditioned for full occupancy, and an after-hours access event should not be treated as an isolated signal.
Leak Detection is at seven.
The category that makes the strongest financial case in the fewest words. Water damage is the number one insurance claim across CRE. The cost of a water event—damage, business interruption, insurance loading—vastly exceeds the cost of the monitoring that would have caught it early.
Early detection integrations convert reactive emergencies into preventable incidents; the fact that it ranks seventh rather than higher up the list reflects an adoption curve, not a priority issue.
Lighting closes the list at eight
In this instance, the numbers make the case: lighting typically represents 15–20% of a commercial building’s energy consumption.
Fifteen lighting integrations enable portfolio-wide scheduling, occupancy-based dimming, and circadian lighting programs that are increasingly tied to WELL and tenant wellbeing commitments. Lighting optimization isn’t a marginal gain at that scale of energy share.
Fragmentation isn’t a transition phase
The most important thing the integration ranking reveals is what the distribution says about the underlying market structure. Eight categories, 250+ integrations, yet no dominant vendor across any of them.
Heterogeneity is now a permanent characteristic of the built world. Different systems have different replacement cycles, ownership structures, procurement paths, and operational requirements. The future isn’t one vendor stack, however; it should be the intelligent orchestration across many.
The reasons are structural. Different systems have different replacement cycles, regulatory contexts, and procurement routes. A lighting upgrade doesn’t happen at the same time as a BAS refresh. An access control system isn’t ripped out because a landlord changes their energy metering platform.
What this means operationally is that portfolio-wide visibility—the kind required for ESG disclosure, for capex planning, or demonstrating building performance to institutional investors—cannot be achieved by managing each system in isolation. It requires a normalization layer that sits above the vendor stack, not within it.
The instinct is often to add another specialist tool when a capability gap appears. That instinct compounds the problem, resulting in deepening fragmentation.
Every additional point solution carries another protocol, dashboard, data format, and integration to maintain, until the stack becomes a literal patchwork of systems.
Interoperability critical for AI-building enablement
The ultimate promise of these integrated stacks is the move toward truly autonomous building operations. However, AI cannot find efficiencies in a vacuum.
It requires high-fidelity, cross-category data streams—from occupancy to thermal comfort—that only a unified layer provides.
AI doesn’t eliminate fragmentation. It amplifies whatever operational structure already exists. If the building operates as disconnected silos, the AI learns disconnected silos. Before buildings become intelligent, they must first become operationally unified.
That operational layer becomes the foundation for predictive maintenance, autonomous operations, and portfolio-wide optimization.
What the data actually argues for
‘The integration ranking is a useful corrective for many vendor-led narratives questioning where the smart building market is headed.
This is because asset owners are not deploying technology in pursuit of an abstract intelligence goal. Instead, they’re connecting systems where the business case is clearest: energy cost, compliance exposure, utilization accountability, maintenance efficiency, security, and asset protection.
These priorities won’t shift dramatically in the next few years. But what will shift is the expectation around ensuring data consistency across them.
Institutional investors, ESG frameworks, and increasingly sophisticated tenants are all carrying an expectation that building performance data needs to be portfolio-wide, consistent, and auditable—not available in eight separate systems, unconnected via eight separate dashboards.
The market is no longer deciding which individual building technologies matter most. It’s deciding which operational layer those technologies will ultimately run through. The owners who understand that shift early are already operating differently from everyone else.