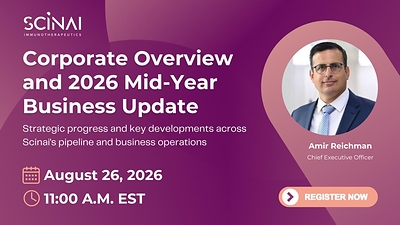
Investor webinar scheduled for August 26, 2026 at 11:00 a.m. EDT
JERUSALEM, Aug. 24, 2026 /PRNewswire/ – Scinai Immunotherapeutics Ltd. (NASDAQ: SCNI) (“Scinai” or the “Company”), a biopharmaceutical company combining innovative therapeutic development with a revenue-generating contract development and manufacturing organization (“CDMO”), today provided a corporate update and reported financial results for the six months ended June 30, 2026.
Corporate Highlights
- Committed Customer Orders1 reached approximately $3.1 million as of August 16, 2026, of which approximately $2.1 million had been invoiced.
- The Company is progressing an expanded clinical manufacturing and CMC program for a U.S.-based biopharmaceutical company building on an existing contractual relationship and prior work performed through the customer’s affiliate.
- Approximately $650 thousand in cash payments and advances have been received in connection with the expanded U.S. program, and substantive activities are underway while the definitive agreement covering the broader scope and commercial terms remains under negotiation.
- The expanded program is intended to support an investigational drug product toward U.S. IND submission and Phase III clinical development.
- The Company continues to pursue approximately $5 million in CDMO revenues for 2026
First Half 2026 Financial Results
- Revenues increased to $949 thousand, compared with $773 thousand for the six months ended June 30, 2025. The increase was primarily attributable to the inclusion of revenues generated by the acquired Yavne operations from the acquisition date. Revenue recognized during the period reflects only the portion of customer engagements for which the applicable services had been performed and revenue recognition criteria satisfied through June 30, 2026, and does not reflect the full value of signed customer work orders extending beyond the reporting period.
- Cost of revenues increased to $3.3 million, compared to approximately $2.0 million for the six months ended June 30, 2025, primarily reflecting the expanded cost base of our CDMO business following the acquisition and consolidation of the Yavne operations, including additional personnel, facility, depreciation and other manufacturing-related costs.
- Gross loss was approximately $2.4 million, compared with approximately $1.3 million in the prior-year period, reflecting the expanded operating cost base of the Company’s CDMO platform while facility utilization continues to increase.
- Research and development expenses decreased to approximately $0.8 million, compared to approximately $1.2 million for the six months ended June 30, 2025 primarily reflecting a lower level of research and development expenditures during the period and the continuing allocation of resources toward our CDMO activities, partially offset by expenditures associated with our current therapeutic development programs, including the PinCell arrangement and NanoAb activities.
- Marketing, general and administrative expenses increased to approximately $1.4 million, compared to approximately $1.3 million for the six months ended June 30, 2025 reflecting, among other things, the expanded corporate and administrative requirements associated with the acquisition and integration of the Yavne operations and operation of the enlarged group structure.
- Operating loss was approximately $4.6 million, compared with approximately $3.8 million for the first half of 2025.
- Net income was approximately $1.6 million, compared with a net loss of approximately $4.1 million in the prior-year period, primarily reflecting an approximately $6.4 million bargain purchase gain associated with the acquisition of Recipharm Israel. The bargain purchase gain does not represent operating revenue or operating cash flow.
- Net cash used in operating activities was approximately $3.9 million, compared with approximately $2.6 million in the first half of 2025.
- Cash, cash equivalents and restricted cash totaled approximately $2.9 million as of June 30, 2026, and shareholders’ equity was approximately $11.7 million. At the closing of the acquisition, Recipharm Israel held approximately €2.0 million in cash, alongside funds for certain pre-closing expenses and liabilities. The acquired cash contributed to the Company’s post-acquisition liquidity position.
CEO Commentary
Amir Reichman, Chief Executive Officer of Scinai, commented:
“The first half of 2026 was focused on expanding and integrating our CDMO platform. As we move through the second half of the year, our focus is increasingly on commercial execution, increasing facility utilization and converting the capabilities we have built into revenue.
We are particularly encouraged by the expansion of an existing U.S. customer engagement from an initial feasibility and cGMP-readiness project into a broader proposed clinical manufacturing and CMC program designed to support a planned U.S. IND submission and Phase III clinical development with potential future expansion into commercial manufacturing. We have already received approximately $650 thousand in cash payments and advances and commenced substantive activities while the definitive agreement covering the expanded scope and commercial terms is being negotiated.
We believe this opportunity is significant not only because of its potential financial contribution, but also because successful execution would demonstrate our ability to support an advanced U.S. clinical development program through CMC development, manufacturing readiness and clinical cGMP manufacturing.
Our priorities for the remainder of 2026 are clear: execute our existing customer programs, convert our commercial pipeline into revenue, increase utilization of our Jerusalem and Yavne facilities, progress this significant U.S. opportunity and continue advancing our therapeutic programs with disciplined capital allocation.”
R&D Update
Scinai continues to pursue a capital-efficient development strategy focused on PC111 and its NanoAbs platform.
For PC111, the Company is evaluating its funding and development path, including potential participation in a future Polish FENG funding round, and is in discussions with PinCell regarding a potential extension of the existing option arrangement.
For the NanoAbs platform, Scinai continues to prioritize its systemic IL-17 bispecific antibody program and its research collaboration and license arrangements with the Max Planck Society and University Medical Center Göttingen.
Investor Webinar
Scinai will provide additional perspective on the expanded U.S. clinical manufacturing opportunity, its broader CDMO commercial pipeline, progress across its R&D programs, including PC111 and the NanoAbs platform, and its strategic priorities for the remainder of 2026 during an investor webinar on August 26, 2026 at 11:00 a.m. EDT.
Investors and other interested parties are invited to register here: LINK
The webinar will include a management presentation followed by a question-and-answer session.
About Scinai Immunotherapeutics
Scinai Immunotherapeutics Ltd. (Nasdaq: SCNI) is a biopharmaceutical company focused on the development of innovative immunology therapies and the operation of a contract development and manufacturing organization.
The Company is advancing therapeutic programs based on technology licensed from the Max Planck Society and pursuant to its option arrangement with PinCell S.r.l.
Scinai also owns Scinai Biopharma Services Ltd., a CDMO providing development and manufacturing services to biotechnology and pharmaceutical companies through facilities in Jerusalem and Yavne, Israel.
For more information, please visit www.scinai.com.
Company Contacts
Business Development | +972 8 930 2529 | [email protected]
Investor Relations, Allele Capital Partners | +1 978 857 5075 | [email protected]
(1) Committed Customer Orders
- We define “committed customer orders” as the aggregate value of signed customer purchase orders for specified CDMO services under existing contractual arrangements, whether or not such amounts have been invoiced. Management uses committed customer orders as an indicator of committed commercial activity and anticipated CDMO utilization, and we believe this measure provides investors with useful information regarding the value of customer-authorized projects under signed purchase orders.
- Committed customer orders are presented for supplemental informational purposes only and are not intended as a substitute for GAAP financial measures. Although customer purchase orders are generally non-cancellable, committed customer orders should not be interpreted as an indication of future revenue or cash receipts. The timing and amount of revenue recognition and cash payments depend on various factors, including performance of the applicable services, achievement of contractual milestones and satisfaction of the relevant accounting criteria. Projects may also be delayed, modified or remain open for extended periods.
Forward-Looking Statements
This press release contains forward-looking statements within the meaning of the U.S. Private Securities Litigation Reform Act of 1995 and other applicable securities laws. Forward-looking statements include, among other things, statements regarding the growth of the Company’s CDMO business; Committed Customer Orders; future and expansion of existing customer engagements and business-development opportunities; utilization of the Jerusalem and Yavne facilities.
These statements are based on current expectations and assumptions and are subject to risks and uncertainties that could cause actual results to differ materially from those expressed or implied by such statements. These risks and uncertainties include, without limitation, risks that the Company will be unable to execute customer projects and convert commercial opportunities into recognized revenue and cash flow; that the contemplated expanded clinical manufacturing and CMC program for a U.S.-based biopharmaceutical company will not be an beneficial to the Company as anticipated, will not occur or will be delayed; that the Company will not successfully negotiate and execute definitive customer agreements; that the Company will not successfully perform development, scale-up and cGMP manufacturing activities; that the Company will not increase facility utilization, attract and retain customers and partners; that the Company will not achieve its revenue targets; that the Company will not successfully advance its PC111 and the NanoAbs platform; that the Company will not succeed in obtaining potential non-dilutive funding from its grant applications; that the Company will be unable to obtain sufficient financing or non-dilutive funding; and that the Company will be unable to regain and maintain compliance with Nasdaq’s continued-listing requirements. Additional risks and uncertainties are described in the Company’s filings with the U.S. Securities and Exchange Commission.
Forward-looking statements speak only as of the date of this press release. Except as required by applicable law, the Company undertakes no obligation to update or revise any forward-looking statements.
SCINAI IMMUNOTHERAPEUTICS LTD
CONDENSED CONSOLIDATED INTERIM FINANCIAL STATEMENTS
As of June 30, 2026
Unaudited
|
CONDENSED CONSOLIDATED BALANCE SHEETS |
||||||
|
U.S. dollars in thousands |
||||||
|
June 30, |
December 31, |
|||||
|
2026 |
2025 |
|||||
|
ASSETS |
||||||
|
CURRENT ASSETS: |
||||||
|
Cash and cash equivalents |
$ |
2,654 |
$ |
1,661 |
||
|
Restricted cash |
199 |
150 |
||||
|
Prepaid expenses and other receivables |
561 |
170 |
||||
|
Trade receivables |
74 |
73 |
||||
|
Total current assets |
3,488 |
2,054 |
||||
|
NON-CURRENT ASSETS: |
||||||
|
Property, plant and equipment, net |
10,711 |
7,793 |
||||
|
Operating lease right-of-use assets |
2,976 |
1,779 |
||||
|
Total non-current assets |
13,687 |
9,572 |
||||
|
Total assets |
$ |
17,175 |
$ |
11,626 |
||
|
The accompanying notes are an integral part of the condensed consolidated financial statements. |
||||||
|
CONDENSED CONSOLIDATED BALANCE SHEETS |
|||||
|
U.S. dollars in thousands (except share data) |
|||||
|
June 30, |
December 31, |
||||
|
2026 |
2025 |
||||
|
LIABILITIES NET OF CAPITAL DEFICIENCY |
|||||
|
CURRENT LIABILITIES: |
|||||
|
Trade payables |
$ |
844 |
$ |
407 |
|
|
Operating lease liabilities |
369 |
329 |
|||
|
Other payables |
1,019 |
849 |
|||
|
Total current liabilities |
2,232 |
1,585 |
|||
|
NON-CURRENT LIABILITIES: |
|||||
|
Loan from others |
285 |
294 |
|||
|
Non-current operating lease liabilities |
2,926 |
1,644 |
|||
|
Total non-current liabilities |
3,211 |
1,938 |
|||
|
CONTINGENT LIABILITIES AND COMMITMENTS |
|||||
|
SHAREHOLDERS’ EQUITY: |
|||||
|
Ordinary shares of no par value: Authorized: 1,600,000,000,000 |
– |
||||
|
Preferred shares, no par value; Authorized: 1,000 shares |
5,627 |
5,627 |
|||
|
Additional paid-in capital |
132,516 |
130,062 |
|||
|
Accumulated deficit |
(124,272) |
(125,846) |
|||
|
Accumulated other comprehensive loss |
(2,139) |
(1,740) |
|||
|
Total shareholders’ equity |
11,732 |
8,103 |
|||
|
Total liabilities and shareholders’ equity |
$ |
17,175 |
$ |
11,626 |
|
|
CONDENSED CONSOLIDATED INTERIM STATEMENTS OF OPERATIONS |
||||||
|
U.S. dollars in thousands (except share data) |
||||||
|
For the six months ended June 30, |
||||||
|
2026 |
2025 |
|||||
|
Revenues |
949 |
773 |
||||
|
Cost of revenues |
$ |
(3,319) |
$ |
(2,043) |
||
|
Gross profit (loss) |
(2,370) |
(1,270) |
||||
|
Research and development expenses, net |
(839) |
(1,237) |
||||
|
Marketing, general, and administrative expenses |
(1,404) |
(1,256) |
||||
|
Total operating expenses |
(2,243) |
(2,493) |
||||
|
Total operating profit (loss) |
(4,613) |
(3,763) |
||||
|
Gain from bargain purchase |
6,401 |
– |
||||
|
Total Financial Income (Expenses) net, |
(214) |
(371) |
||||
|
Net profit (loss) |
$ |
1,574 |
$ |
(4,134) |
||
|
Net loss per share attributable to ordinary shareholders, basic |
(*) |
(0.001) |
||||
|
Weighted average number of shares used in computing net |
30,189,667,540 |
6,364,731,650 |
||||
|
*Less than $0.01 |
||||||
|
The accompanying notes are an integral part of the condensed consolidated financial statements. |
||||||
|
CONDENSED CONSOLIDATED INTERIM STATEMENTS OF OPERATIONS |
||||||
|
U.S. dollars in thousands (except share data) |
||||||
|
For the six months ended June 30 |
||||||
|
2026 |
2025 |
|||||
|
Net profit (loss) |
$ |
1,574 |
$ |
(4,134) |
||
|
Other comprehensive income: |
||||||
|
Foreign currency translation |
(399) |
– |
||||
|
Total comprehensive profit (loss) |
1,175 |
$ |
(4,134) |
|||
|
CONDENSED CONSOLIDATED INTERIM STATEMENTS OF CHANGES IN SHAREHOLDERS’ EQUITY |
|||||||||||||||||||||||||||||
|
U.S. dollars in thousands (except share data) |
|||||||||||||||||||||||||||||
|
Ordinary shares |
Preferred shares |
Additional |
Accumulated |
Accumulated |
Total |
||||||||||||||||||||||||
|
Number |
Amount |
Number |
Amount |
paid-in capital |
comprehensive loss |
|
shareholders’ |
||||||||||||||||||||||
|
Balance as of January 1, 2026 |
13,872,899,584 |
– |
1,000 |
$ |
5,627 |
130,062 |
(1,740) |
(125,846) |
8,103 |
||||||||||||||||||||
|
Vested RSU’s |
279,100,000 |
– |
– |
– |
– |
– |
– |
||||||||||||||||||||||
|
Share-based compensation |
– |
– |
– |
– |
128 |
– |
128 |
||||||||||||||||||||||
|
Issuance of pre-funded warrants, net of |
8,598,960,000 |
2,321 |
2,321 |
||||||||||||||||||||||||||
|
Cumulative translation adjustment |
(399) |
(399) |
|||||||||||||||||||||||||||
|
Issuance of ordinary shares |
49,928,000 |
– |
– |
– |
5 |
– |
5 |
||||||||||||||||||||||
|
Net profit (loss) |
– |
– |
– |
– |
– |
– |
1,574 |
1,574 |
|||||||||||||||||||||
|
Balance as of June 30, 2026 |
22,800,887,584 |
– |
1,000 |
5,627 |
132,516 |
(2,139) |
(124,272) |
11,732 |
|||||||||||||||||||||
|
*Ordinary shares have no par value |
|||||||||||||||||||||||||||||
|
Ordinary shares |
Preferred shares |
Additional |
Accumulated |
Total |
|||||||||||||||||||||||||
|
Number |
Amount |
Number |
Amount |
paid-in capital |
comprehensive loss |
Accumulated |
shareholders’ |
||||||||||||||||||||||
|
Balance as of January 1, 2025 |
3,411,983,584 |
* |
1,000 |
$ |
5,627 |
$ |
123,629 |
$ |
(1, 740( |
( |
$ |
(117,539 ) |
$ |
9,977 |
|||||||||||||||
|
Vested RSU’s |
32,816,000 |
– |
– |
– |
– |
– |
– |
– |
|||||||||||||||||||||
|
Share-based compensation |
270 |
270 |
|||||||||||||||||||||||||||
|
Exercise of prefunded warrants |
322,944,000 |
– |
– |
– |
– |
– |
– |
– |
|||||||||||||||||||||
|
Issuance of ordinary shares |
2,288,880,000 |
– |
– |
– |
$ |
1,745 |
– |
– |
$ |
1,745 |
|||||||||||||||||||
|
Net loss |
– |
– |
– |
– |
– |
– |
(4,134) |
(4,134) |
|||||||||||||||||||||
|
Balance as of June 30, 2025 |
6,056,623,584 |
– |
1,000 |
$ |
5,627 |
$ |
125,644 |
$ |
(1,740() |
$ |
(121,673) |
$ |
7,858 |
||||||||||||||||
|
CONDENSED CONSOLIDATED INTERIM STATEMENTS OF CASH FLOWS |
||||||||
|
U.S. dollars in thousands |
||||||||
|
For the six months |
||||||||
|
2026 |
2025 |
|||||||
|
Cash flows from operating activities: |
||||||||
|
Net profit (loss) |
$ |
1,574 |
$ |
(4,134) |
||||
|
Adjustments to reconcile net income (loss) to net cash used in operating activities: |
||||||||
|
Depreciation of property, plant and equipment |
1,039 |
704 |
||||||
|
Financial expense (income) related to loan from others |
(9) |
33 |
||||||
|
Share-based compensation |
128 |
270 |
||||||
|
Decrease (increase) in trade receivables |
129 |
(56) |
||||||
|
Gain from bargain purchase |
(6,401) |
– |
||||||
|
Decrease (increase) in other receivables |
(233) |
(23) |
||||||
|
Effect of exchange rate changes on cash, cash equivalents and restricted cash |
(226) |
(42) |
||||||
|
SEPA commitment fees |
164 |
|||||||
|
Changes in operating lease right-of-use assets |
117 |
31 |
||||||
|
Increase in trade payables |
264 |
283 |
||||||
|
Changes in operating lease liabilities |
(117) |
237 |
||||||
|
Increase (decrease) in other payables |
(185) |
(42) |
||||||
|
Net cash used in operating activities |
(3,920) |
(2,575) |
||||||
|
Cash flows from investing activities: |
||||||||
|
Purchase of property, plant and equipment |
(115) |
(12) |
||||||
|
Cash received in business combination |
2,751 |
– |
||||||
|
Net cash used in investing activities |
$ |
2,636 |
$ |
(12) |
||||
|
CONDENSED CONSOLIDATED INTERIM STATEMENTS OF CASH FLOWS |
|||||||||
|
U.S. dollars in thousands |
|||||||||
|
For the six months ended June 30, |
|||||||||
|
2026 |
2025 |
||||||||
|
Cash flows from financing activities: |
|||||||||
|
Proceeds from issuance of ordinary shares for SEPA holders, net |
5 |
1,581 |
|||||||
|
Proceeds pre-funded warrants for PIPE holders, net |
2,321 |
||||||||
|
Net cash provided by financing activities |
2,326 |
1,581 |
|||||||
|
Effect of exchange rate changes on cash, cash equivalents and restricted cash |
– |
42 |
|||||||
|
Increase (decrease) in cash, cash equivalents and restricted cash |
1,042 |
(946) |
|||||||
|
Cash, cash equivalents and restricted cash at beginning of period |
1,811 |
2,095 |
|||||||
|
Cash, cash equivalents and restricted cash at end of period |
$ |
2,853 |
1,131 |
||||||
|
Non-cash transactions: |
|||||||||
|
Shares issued for SEPA financing agreement |
$ |
6 |
100 |
||||||
|
Reconciliation of cash, cash equivalents and restricted cash: |
|||||||||
|
Cash and cash equivalents |
$ |
2,654 |
989 |
||||||
|
Restricted cash |
199 |
142 |
|||||||
|
Cash, cash equivalents and restricted cash |
$ |
2,853 |
1,131 |
||||||
 View original content to download multimedia:https://www.prnewswire.com/news-releases/scinai-reports-first-half-2026-corporate-highlights-and-results-with-spotlight-on-growing-cdmo-momentum-302858235.html
SOURCE Scinai Immunotherapeutics Ltd.