If you lead data or technology for a large enterprise, you have probably lived through the same sequence of data migrations. Data warehouses gave way to Hadoop, then data lakes, then lakehouses. Each promised consolidation and better analytics. Each required significant reshaping and cost.
So when someone recommends adding a knowledge graph to improve AI results, the reaction is predictable. “Seriously? Again?”
Fortunately, adopting graph technology does not require another all-in migration. You do not need to boil your data lake. A knowledge graph lets you be selective. It connects what you already have and turns data into knowledge without lifting and shifting everything.
A Layer That Adds Meaning
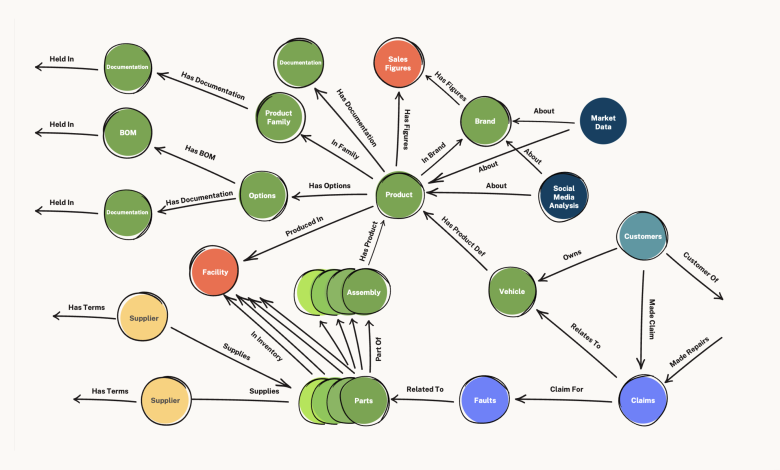
A knowledge graph is a map of meaning that describes how things relate to one another. It highlights the connections that explain how a business works. These relationships create a layer that sits across existing systems. The warehouse or lake continues to store raw details. The graph provides structure and context so AI can reason with more accuracy and transparency.
This layer is small by design. A lake delivers value when it holds 60-100% of enterprise data. A knowledge graph usually starts with 1-5% of total data. Even if someone captured every important entity and relationship in their organization, the total would still represent a small fraction of all the data. This is because knowledge is signal, not noise.
A Useful Range of Options
Companies adopt graphs at different levels of depth. One global videogaming company began with only metadata. They mapped databases, tables and linkages across hundreds of thousands of objects. That entire graph fit on a thumb drive and gave the company immediate lineage and governance insights.
At the other end of the range, a major buy-now, pay-later provider consolidated data from 1,500 SaaS applications into a graph. The goal was to create a more complete view of customers and how they interact with the business, while also significantly streamlining operations by reducing the number of SaaS applications storing data.
Most organizations choose a practical middle ground. They start with one problem, identify which entities and relationships matter, then use the graph as a connective layer across a few silos. As value emerges, they gradually expand the model by adding new data sources to address other business problems.
Deciding What Belongs in the Graph
The first question leaders often ask me is what data to include in the graph. Focus on entities and relationships rather than granular events. A graph should contain identities such as customers, employees, accounts and devices along with the relationships among them. It should also include state changes that matter for decisions.
Low value events stay in the lake. A retailer, for instance, might store closed purchase transactions in the graph. Individual shopping cart additions or every page view do not belong there because those signals do not carry the same meaning as an actual purchase. If they do, it’s certainly not the highest-value first step; and there are techniques for condensing and summarizing such data to improve signal-to-noise ratio.
Even for very large businesses, a well-scoped graph can be quite manageable. A company with more than a million employees can represent skills, reporting lines, and job postings in roughly one hundred million graph elements and perhaps a few hundred million connections. That’s not nothing, but it’s nothing near petabytes or even terabytes of data.
Yes, there is a case for billions- and trillions-scale graphs. But you don’t have to start at that scale. The great thing about graphs is that if you choose a graph database with a flexible schema, you can easily add in new data as you go, rather than feel the pressure of modeling out more than you need at the time. If a first version of a graph feels unmanageable, that’s usually a sign that there’s more noise in the data than signal, calling for another look at what data is significant.
Start With Purpose
Successful graph projects begin with a business problem. Pick a use case such as fraud detection, customer 360, or supply chain resilience. There are many use cases involving high-value domains in a business that naturally show up as networks, hierarchies/trees, or journeys. Identify the specific questions needing an answer. Model the entities and relationships that support those questions. And use the latest AI-powered graph ingestion tech to source it into the graph.
Once the foundation exists, the next use case becomes faster, because it can reuse the knowledge already structured. This is how organizations avoid rebuilding from scratch each time. Graph technology supports data network effects, where each additional data set added to the graph results in mutual and multiplicative value; and use-case network effects, where the data used to solve a designated business problem is often a building block that helps solve a different and valuable subsequent problem.
Clear and swift outcomes are the signal that the scope was right. We are seeing projects achieve initial success as soon as three months from start, thanks to the power of AI in accelerating what were previously long-running activities like graph construction and querying.
For example: strong e-commerce signs include increased frequency of purchases, larger shopping baskets, and lower abandonment. Service teams may see shorter resolution times. One global networking platform reduced customer service issue resolution by 28% after using a graph to ground retrieval augmented generation.
A Choice, Not Another Migration
A senior data leader I spoke with recently summed up a decade of transition fatigue. “We have had two to five major platform migrations every year since 2013. It hurts. Our primal fear is that graphs are another one.”
When they realized a graph does not require moving all the data and that most value comes from a small, focused subset, their response was simple. “You just reduced my cortisol level by 10X.”
That’s the expectation shift more leaders need to hear. A knowledge graph is not another platform to migrate into. It is a layer that helps you get more value out of the systems you already trust. Start with the signal, not the entire lake. Start small, connect quickly, and scale as value appears.
Your data stays where it is. The graph makes it more valuable by extracting, connecting, and serving up your knowledge.