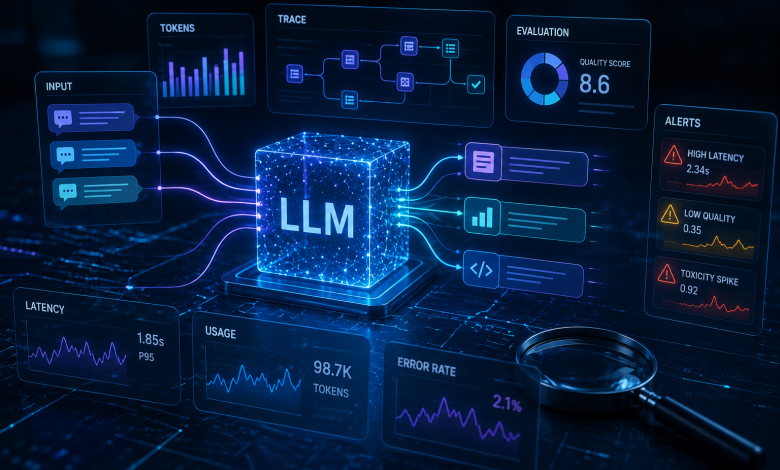
TL;DR: LLM observability is the practice of capturing what your models and agents actually did — the prompts, tokens, latency, cost, tool calls, and failures — so you can debug, control spend, and catch quality regressions. It’s harder than traditional APM because outputs are non-deterministic, cost is metered per token, and a single agent request fans out across models and tools. This guide covers what to log, what to trace, and what to alert on, then shows how the gateway becomes the natural place to capture all of it.
A 200 status code used to mean everything was fine. In an LLM system, it means almost nothing. The request can return 200 and still hand back a hallucination, leak a phone number, cost fifty times what it should, or quietly fall back to a weaker model because the primary was rate-limited. Traditional application monitoring — request counts, error rates, p99 latency — was built for deterministic services, and it goes blind exactly where LLM systems fail.
That’s why LLM observability has become its own discipline. You’re no longer just asking “did the request succeed?” You’re asking “what did the model actually produce, how many tokens did it burn, which provider served it, how long until the first token, did a guardrail fire, and which tool did the agent call along the way?” None of that shows up in a normal APM dashboard. Let’s break down what you actually need to capture, and why each piece matters.
Why LLM observability is different
Three properties make observing LLM traffic fundamentally unlike observing a REST API.
First, outputs are non-deterministic. The same prompt can produce different completions, so you can’t assert on exact responses. You have to observe distributions — token counts, latencies, quality scores — over many requests, and watch for drift rather than a single broken assertion.
Second, cost is a first-class runtime metric. Every call carries a dollar figure driven by input and output tokens. If you’re not logging cost per request and attributing it, you find out about a problem when finance forwards the invoice. Cost isn’t a billing concern you check monthly; it’s a signal you monitor in real time, right next to latency.
Third, one request fans out. A single agent turn might call a model, hit a retrieval step, invoke two tools over MCP, then call the model again to summarize. If you only log the top-level request, you have no idea which hop was slow, expensive, or wrong. You need distributed tracing that stitches the whole chain into one view — the way you’d trace a microservice call graph, except the “services” are models and tools.
What to log
Logging is your event-level record — one entry per request, queryable after the fact. At minimum, capture:
- The full request and response (prompt, completion, model, parameters) — with the ability to redact sensitive fields. This is what you go back to when a user reports a bad answer.
- Token counts, input and output separately, since they price differently.
- Cost per request, computed from tokens and the model’s rate.
- Model and provider actually served, including whether a fallback or a different region handled it.
- Latency, ideally split into time-to-first-token and total latency for streaming.
- Identity and attribution — which user, team, application, or API key made the call.
- Guardrail outcomes — did an input or output check block, mutate, or pass the request.
The attribution piece is the one teams skip and later regret. Without it, “our AI bill doubled” is a mystery; with it, it’s “this team’s new batch job doubled the bill,” which is a fix.
What to trace
Traces are where LLM observability earns its keep. A trace captures a single request as a tree of spans, each hop appearing as its own node with timing, tokens, and status. For a RAG-plus-agent request, a useful trace shows the retrieval span, each model call, and each tool invocation, so you can see exactly where the 4-second latency or the surprise cost came from.
Good LLM tracing captures per-span detail like time-to-first-token, total latency, input and output tokens, inter-token latency for streaming, and the computed cost — not just a start and end timestamp. That granularity is what lets you answer “why was this request slow?” with “the second tool call took 3 seconds,” instead of shrugging at an opaque total.
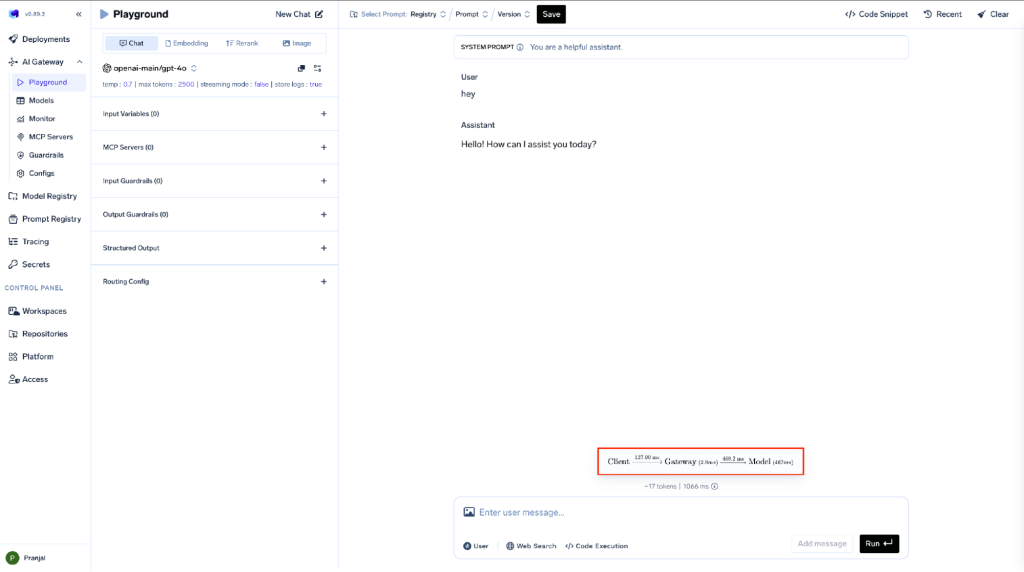
A per-request latency breakdown in the TrueFoundry AI Gateway, isolating gateway processing (~3 ms) from model processing time.
What to alert on
Dashboards are for investigation; alerts are for the things you can’t afford to notice late. Prioritize:
- Cost anomalies — a spike in spend per team or per model, which usually means a loop, a bug, or abuse. This is the single highest-value LLM alert.
- Latency SLA breaches — rising time-to-first-token or time-per-output-token, often the first sign a provider is degrading.
- Error and fallback rates — a jump in 429s or in fallback activations means your primary provider is struggling before users complain.
- Guardrail firing rates — a surge in PII redactions or blocked prompts can signal misuse or a prompt-injection attempt.
- Token/output drift — sudden changes in average output length can flag a prompt regression or a model change upstream.
The theme: alert on the economic and safety signals unique to AI, not just the HTTP-level ones your existing monitoring already covers.
Where the gateway fits
Here’s the practical problem: instrumenting all of this by hand, in every service, is brittle and inconsistent. Every team ends up logging different fields, and cross-service traces never quite line up. Because an AI gateway already sits in the path of every model and tool call, it’s the natural place to capture observability once, consistently, for everything — no per-app SDK sprawl required.
How TrueFoundry implements LLM observability
TrueFoundry treats observability as a property of the gateway rather than an add-on, and the detail is where it gets interesting. Because the gateway is already in the path of every call, you don’t instrument anything — you point your app at the gateway using the standard OpenAI SDK, and every request is traced automatically:
from openai import OpenAI
client = OpenAI(
base_url=“https://<your-gateway>.truefoundry.com/api/llm”,
api_key=“<tfy-api-key>”,
)
# This call is captured as an OpenTelemetry trace — tokens,
# cost, latency, model, and caller identity — with no extra code.
resp = client.chat.completions.create(
model=“openai-main/gpt-4o”,
messages=[{“role”: “user”, “content”: “Summarize the Q3 report.”}],
)
Every request is captured as an OpenTelemetry trace, with rich span attributes that map exactly to the signals above:
{
“tfy.model.metric.time_to_first_token_in_ms”: 412,
“tfy.model.metric.latency_in_ms”: 1840,
“tfy.model.metric.input_tokens”: 1203,
“tfy.model.metric.output_tokens”: 268,
“tfy.model.metric.inter_token_latency_in_ms”: 21,
“tfy.model.metric.cost_in_usd”: 0.0091
}
So cost and streaming latency aren’t bolted-on estimates; they’re first-class fields on every span. You can see the same data rolled up in the dashboard, attributed by model, user, or team:
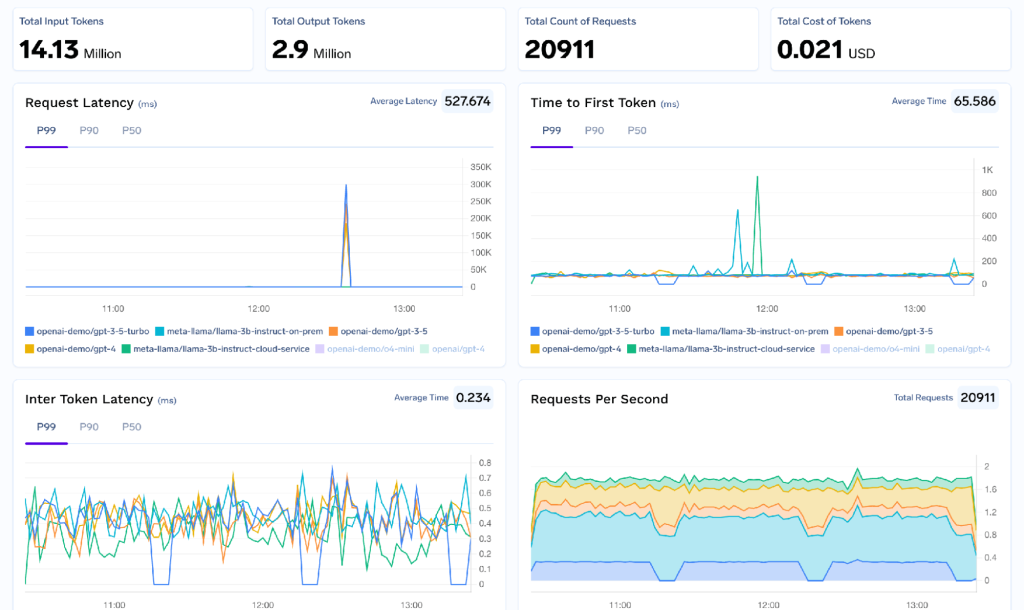
Cost and usage attribution in the TrueFoundry AI Gateway — the foundation for cost-anomaly alerting.
Trace storage is managed by TrueFoundry out of the box, so you get an observability UI without standing up a backend. But you’re not locked in: the gateway can also export traces over OpenTelemetry to the platform you already run — Datadog, New Relic, Dynatrace, Splunk Observability Cloud, Arize, Grafana, and others via OTLP.
Traces are stored by TrueFoundry and can also be exported to any OTLP-compatible platform.
One useful nuance to know going in: the OTEL traces exporter sends trace data, and metrics export is configured separately, so you wire each to its intended destination rather than assuming one carries the other. Because the gateway also governs guardrails and MCP tool calls, the same telemetry extends past model calls — guardrail outcomes and MCP tool invocations are traced with attribution, so a single view spans prompt, model, guardrail, and tool. That’s the difference between observing “an LLM call happened” and understanding what your agents are actually doing in production.
FAQ
Q: What is LLM observability? A: It’s capturing and analyzing what your LLM applications and agents do at runtime — prompts, token usage, cost, latency, tool calls, guardrail outcomes, and failures — so you can debug issues, control spend, and detect quality regressions. Unlike traditional monitoring, it treats cost and output quality as first-class signals.
Q: What should you log for LLM applications? A: At minimum: the request and response (with redaction), input and output token counts, cost per request, the model and provider served, split latency (time-to-first-token and total), caller identity for attribution, and guardrail outcomes.
Q: How is LLM observability different from traditional APM? A: Outputs are non-deterministic, so you watch distributions instead of exact responses; cost is a per-token runtime metric you monitor live; and one request fans out across models and tools, so distributed tracing is essential rather than optional.
Conclusion
LLM observability isn’t traditional monitoring with a new label — it’s a different question set built around non-determinism, per-token cost, and multi-hop agent requests. Get the logging, tracing, and alerting right and you can actually run AI in production instead of hoping it behaves. Capturing it at the gateway is what makes that consistent, and it’s worth seeing how TrueFoundry turns every request into an OpenTelemetry trace you can keep or export wherever you already look.