
The promise of AI inspires awe, but the reality for many organizations is they end up with a nasty shock: spiraling, unpredictable cloud bills that transform AI projects into financial liabilities. While the focus is often on expensive compute resources like GPUs, the true budget killer lurking in the shadows is the hidden cost of data: the relentless expense of storing, moving, processing, and governing the vast datasets necessary for training and maintaining models in production.
This data cost trap is often overlooked during initial planning, and it’s the main reason why budgets suddenly fall off a cliff. The solution requires a proactive shift in architectural design to ensure AI delivers ROI instead of insolvency.
Most data teams get very little warning of what’s about to happen. Often, the first inkling comes when the CFO bursts into the office, waving a printout of last month’s cloud computing bill and demanding answers. The company’s cloud AI infrastructure bill has jumped more than 50% compared to the prior month.
As the person who gave the greenlight to three new pilot projects last month, you’re the one responsible. Those projects may have promised a transformative return on investment, but instead you’ve found yourself facing a massive budget overrun.
The Pain Is Real
The reassuring news is that you’re not the only one perplexed at the spiralling costs of AI. Organizations are throwing more money into their AI investments than ever before, with the average enterprise’s monthly AI budget reaching $85,521 in 2025, up 36% from the year prior, according to data from CloudZero. Yet, just 51% of organizations say they’re able to evaluate whether or not those investments are generating returns with any degree of confidence, the same study found.
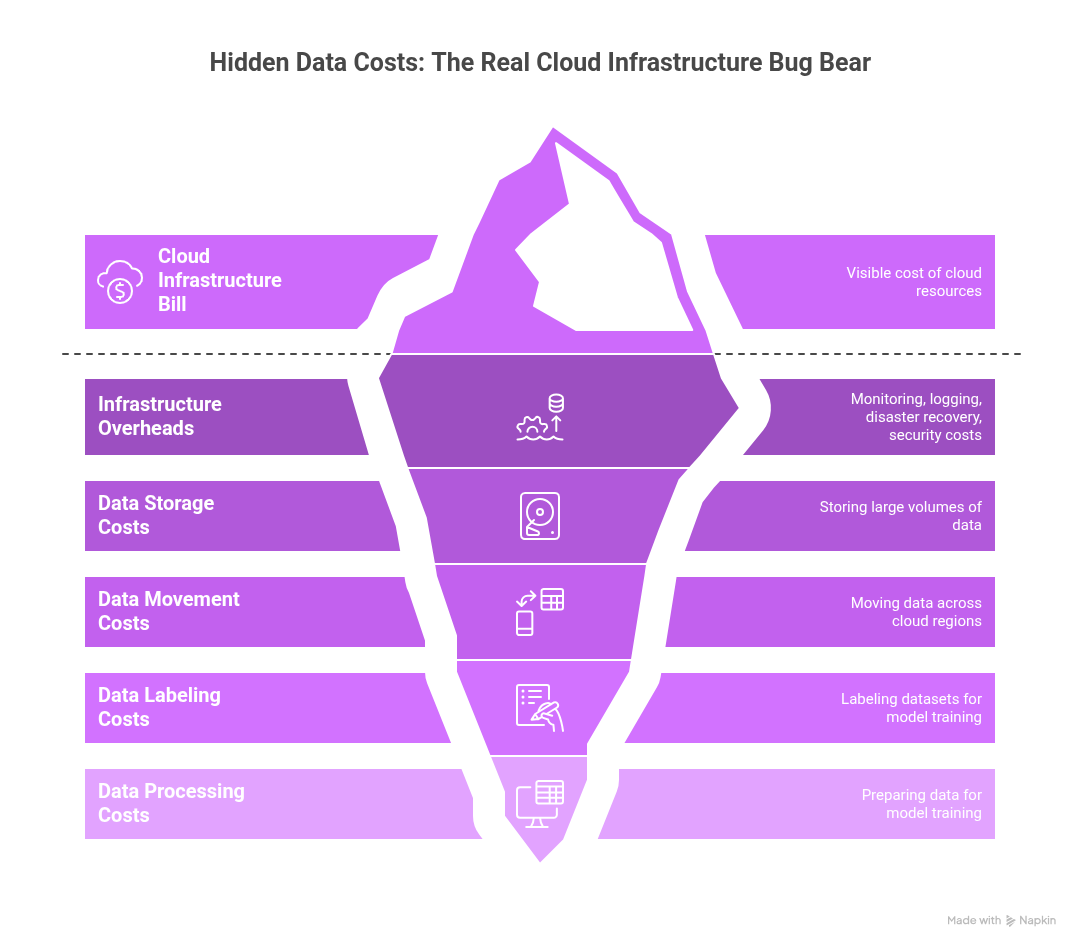
AI costs are running out of control due to a deadly trifecta, with the most predictable expense being the high price of compute resources. GPUs, TPUs and the cloud instances used for AI model inference can run up bills of thousands of dollars per day, with a single, on-demand Nvidia A100 GPU priced at around $3-$5 per hour on public cloud infrastructure platforms. When your large language models are dealing with hundreds of thousands of requests per hour, monthly cloud bills can quickly reach six figures.
Infrastructure overheads are another significant cost driver. The cost of monitoring systems and logging platforms, disaster recovery, security infrastructure and the like can add another 20% to 40% to your base cloud infrastructure bill. But for most organizations, the real problem is not compute nor those overheads. It’s the data costs that are hidden in plain sight. The need to constantly store, move, label, process and prepare data for model training, fine-tuning and so on often exceeds the costs of the underlying cloud resources. Moving terabytes of data across cloud regions is a major undertaking that generates significant and often unpredictable charges.
Why Design Decisions Turn Into Cost Liabilities
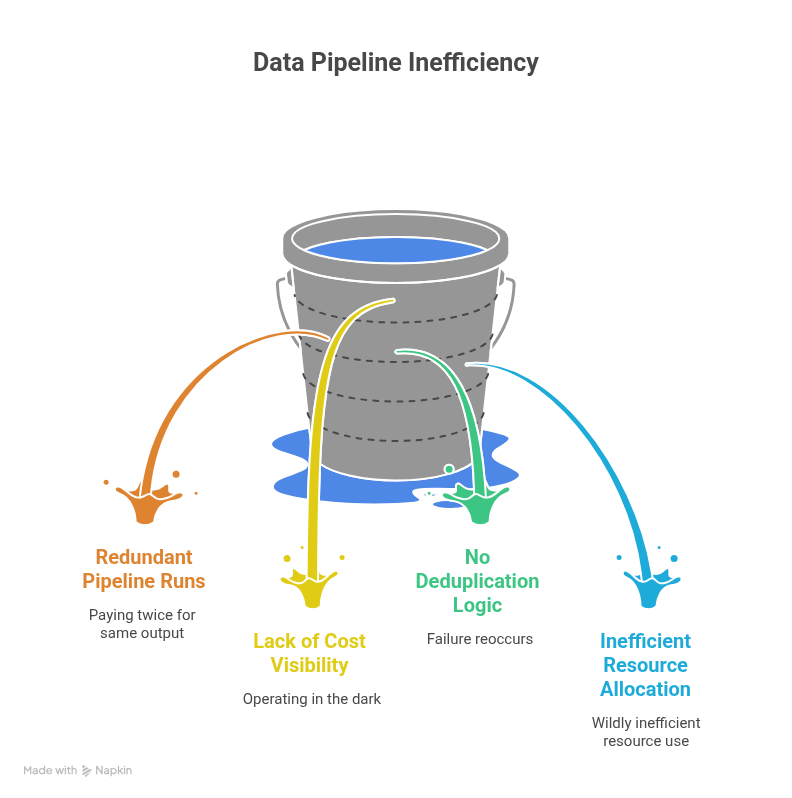
One of the primary causes of eroding AI margins is a phenomenon known as “cost inertia,” which refers to the cumulative financial impact of early technical decisions that become locked in under production load, forcing teams to pay a compounding tax they can’t easily escape. Data pipelines are built at the beginning of any project, and there tends to be a lot of focus on just getting things to work, with little thought on how they can be economized.
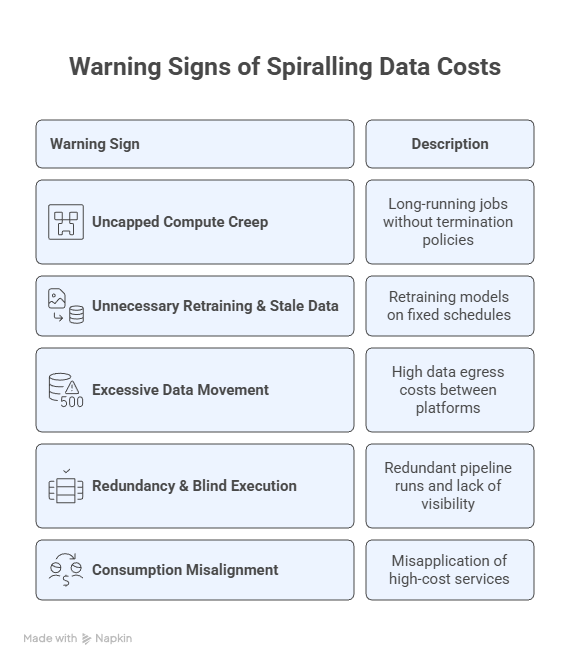
What seemed like a convenient development choice at the time can ultimately transform itself into a budget-busting liability once a project starts ramping up. The only way to stay one step ahead is to remain vigilant and spot the subtle signals that indicate an impending cost spiral. Cost inertia typically manifests through five patterns: uncapped compute creep, unnecessary retraining coupled with stale data in hot storage, excessive data movement and egress charges, redundant pipeline runs without per-job cost visibility, and consumption misalignment where teams default to expensive real-time inference when batch processing would suffice. Each of these is detectable in your platform’s usage logs.
Getting Practical: Auditing the Data Cost Trap in Snowflake
Organizations can get a surprisingly accurate picture of the AI data cost trap, because it’s not something that’s loosely defined. Cost overruns stem from a series of predictable architectural failures, visible right in your cloud data platform’s usage logs.
If you’re running your data on Snowflake, you have the tools to audit your costs surgically, so long as you know where to look. The secret is to tie every dollar of compute and storage spend back to actual business value. When costs spike, it’s almost always due to a handful of anti-patterns that show up clearly in the SNOWFLAKE.ACCOUNT_USAGE schema.
A note on data freshness: Views in ACCOUNT_USAGE can lag by up to several hours. For near-real-time diagnostics, use the corresponding INFORMATION_SCHEMA views where available, though these are scoped to individual databases.
Here are six queries to run today to pinpoint where your data costs are spiraling out of control:
1. Identify Unnecessarily Long-Running Compute
This reveals which compute warehouses have been left running for extended periods, contributing to uncapped compute creep.
Question it answers: Which warehouses are spending the most time running and not suspended?
SELECT
warehouse_name,
SUM(credits_used) AS total_credits_used,
SUM(credits_used_compute) AS compute_credits,
SUM(credits_used_cloud_services) AS cloud_services_credits,
SUM(DATEDIFF(‘second’, start_time, end_time)) / 3600 AS total_hours_active
FROM
SNOWFLAKE.ACCOUNT_USAGE.WAREHOUSE_METERING_HISTORY
WHERE
start_time >= DATEADD(month, -1, CURRENT_TIMESTAMP())
GROUP BY
1
ORDER BY
total_credits_used DESC
LIMIT 5;
What bad looks like:
- A “DEV” or “EXPERIMENTATION” warehouse near the top of the list.
- Total hours active is close to the total hours in the billing period (e.g., 720 hours for a month).
- High total_credits_used with low corresponding business output.
- Significant credits_used_cloud_services indicating long-running metadata operations.
The first fix to try:
- Immediately apply aggressive AUTO_SUSPEND settings (e.g., 60 seconds) to all non-production warehouses.
- Implement a naming convention (e.g., WH_PROD_MODEL_X vs. WH_DEV_SANDBOX) and enforce tighter control over non-PROD suspension.
2. Spot Excessive Query Re-Computation (Redundancy)
This query highlights frequently executed queries, often indicating redundant pipeline runs or a lack of consumed materialized views.
Question it answers: What are the most frequently executed queries consuming the most resources?
SELECT
QUERY_HASH,
ANY_VALUE(QUERY_TEXT) AS sample_query_text,
WAREHOUSE_NAME,
COUNT(*) AS execution_count,
SUM(TOTAL_ELAPSED_TIME) / 1000 AS total_seconds_elapsed,
SUM(BYTES_SCANNED) / POWER(1024, 3) AS total_gb_scanned
FROM
SNOWFLAKE.ACCOUNT_USAGE.QUERY_HISTORY
WHERE
START_TIME >= DATEADD(day, -7, CURRENT_TIMESTAMP())
AND EXECUTION_STATUS = ‘SUCCESS’
AND WAREHOUSE_NAME IS NOT NULL
GROUP BY
1, 3
ORDER BY
execution_count DESC, total_seconds_elapsed DESC
LIMIT 10;
What bad looks like:
- Identical or near-identical transformation queries running dozens of times a day.
- Pipelines re-running full table scans instead of processing incremental changes.
- High execution count for complex ETL/ELT steps that should be materialized once.
The first fix to try:
- Identify highly frequent, resource-intensive queries and materialize their output as a view or table, especially for slow-changing dimensions or features.
- Enforce ELT patterns over ETL, focusing on processing only new data since the last run.
3. Audit Storage Tier Misalignment
Snowflake does a good job of automatically managing micro-partitioning, but unnecessary storage costs can still accumulate from keeping massive amounts of stale data that could be archived or dropped.
Question it answers: Which large tables haven’t been modified recently and may be candidates for archival or cleanup?
SELECT
TABLE_CATALOG || ‘.’ || TABLE_SCHEMA || ‘.’ || TABLE_NAME AS table_name,
BYTES / (1024*1024*1024) AS size_gb,
ROW_COUNT,
LAST_ALTERED
FROM
SNOWFLAKE.ACCOUNT_USAGE.TABLES
WHERE
DELETED IS NULL
AND BYTES IS NOT NULL
AND BYTES > 1073741824 — Tables larger than 1 GB
ORDER BY
BYTES DESC
LIMIT 10;
Note: LAST_ALTERED reflects the last DDL/DML operation, not the last time the table was read. For true access-based auditing, use SNOWFLAKE.ACCOUNT_USAGE.ACCESS_HISTORY (available in Enterprise Edition and above).
What bad looks like:
- Tables measured in hundreds of GB or more with a LAST_ALTERED date over 90 days ago.
- Stale audit logs or historical training data sitting in primary storage.
- High-volume fact tables with no explicit retention policy.
The first fix to try:
- Establish and tag retention policies for all high-volume tables (e.g., 60-day, 90-day, 1-year).
- For identified cold data, implement a process to archive or drop it if it exceeds its required retention policy.
4. Track Runaway Cloud Services Costs
Cloud services credits cover background operations like metadata management, security, and compilation. A high ratio of cloud services to compute credits can signal inefficient or pathological query patterns.
Question it answers: Which warehouse is generating an excessive amount of cloud services usage?
WITH warehouse_costs AS (
SELECT
warehouse_name,
SUM(credits_used) AS total_credits,
SUM(credits_used_cloud_services) AS cs_credits
FROM
SNOWFLAKE.ACCOUNT_USAGE.WAREHOUSE_METERING_HISTORY
WHERE
start_time >= DATEADD(month, -1, CURRENT_TIMESTAMP())
GROUP BY
1
)
SELECT
warehouse_name,
total_credits,
cs_credits,
ROUND((cs_credits / NULLIF(total_credits, 0)) * 100, 2) AS cs_percentage
FROM
warehouse_costs
WHERE
(cs_credits / NULLIF(total_credits, 0)) * 100 > 10
ORDER BY
cs_credits DESC
LIMIT 5;
What bad looks like:
- Cloud services percentage consistently above 10% for large warehouses.
- High CS cost driven by queries that scan massive datasets but return very few rows.
- Excessive use of SHOW commands or frequent, small data load/unload operations.
The first fix to try:
- Identify users or applications driving the high CS usage and advise on query optimization (e.g., using better filters, leveraging clustering keys).
- Consolidate many small data loads/unloads into larger, more efficient batch operations.
5. Detect Inefficient Data Scanning Patterns
Queries that scan disproportionate amounts of data relative to their output are a strong signal of poor clustering, missing filters, or tables that need restructuring.
Question it answers: Which frequently-run queries are scanning disproportionate amounts of data?
SELECT
QUERY_HASH,
ANY_VALUE(QUERY_TEXT) AS sample_query,
COUNT(*) AS executions,
AVG(BYTES_SCANNED) / NULLIF(AVG(ROWS_PRODUCED), 0) AS avg_bytes_per_row,
SUM(BYTES_SCANNED) / POWER(1024, 3) AS total_gb_scanned
FROM
SNOWFLAKE.ACCOUNT_USAGE.QUERY_HISTORY
WHERE
START_TIME >= DATEADD(day, -7, CURRENT_TIMESTAMP())
AND EXECUTION_STATUS = ‘SUCCESS’
AND BYTES_SCANNED > 0
GROUP BY
1
HAVING
COUNT(*) > 5
ORDER BY
total_gb_scanned DESC
LIMIT 10;
For per-table clustering diagnostics, use SYSTEM$CLUSTERING_INFORMATION(‘db.schema.table’) on the specific tables identified above.
What bad looks like:
- High avg_bytes_per_row indicating full table scans where selective filtering should apply.
- Queries scanning hundreds of GB but producing few rows.
- The same tables appearing across multiple high-scan queries.
The first fix to try:
- For tables showing up repeatedly, define a clustering key based on the columns most often used in filters and joins.
- Verify that time-series data is naturally ordered by the timestamp column.
6. Attribute Compute to Owners and Business Units (Optional)
To shift cost management from financial review to operational feedback, you must attribute spend to the teams that incur it. This requires a tagging strategy.
This query requires that your Snowflake account uses object tagging to attribute warehouses to business units. If tagging is not yet configured, skip this query, but consider it a strong signal that cost governance is missing.
Question it answers: How much compute credit is each business unit or project consuming?
SELECT
t.TAG_VALUE AS business_unit,
SUM(c.CREDITS_USED) AS total_credits_spent
FROM
SNOWFLAKE.ACCOUNT_USAGE.WAREHOUSE_METERING_HISTORY c
JOIN
SNOWFLAKE.ACCOUNT_USAGE.TAG_REFERENCES t
ON UPPER(c.WAREHOUSE_NAME) = UPPER(t.OBJECT_NAME)
AND t.DOMAIN = ‘WAREHOUSE’
WHERE
c.START_TIME >= DATEADD(month, -1, CURRENT_TIMESTAMP())
AND t.TAG_NAME = ‘BUSINESS_UNIT’
GROUP BY
1
ORDER BY
total_credits_spent DESC;
What bad looks like:
- A large portion of spend is attributed to ‘UNKNOWN’ or a default tag because no tagging policy is enforced.
- A single, non-core business unit is dominating the overall spend.
- Spikes in spend with no corresponding increase in business value from the owning team.
The first fix to try:
- Mandate tagging. Make it a non-negotiable policy to tag every new warehouse with at least OWNER_TEAM and BUSINESS_UNIT.
- Establish a monthly review meeting where teams are presented with their spend and tasked with justifying credit usage.
Be Proactive To Make AI Productive
The explosive growth of AI has created unprecedented opportunities for enterprise automation and innovation, yet any company pursuing them will find itself on a financial tightrope. AI is data- and compute-intensive, and the costs of implementing it can far outweigh any financial benefits if not managed carefully.
To escape the cost trap, enterprises must shift their focus away from simply getting applications up and running. They must architect cost-awareness into their AI projects from the ground up. The approach outlined above can transform cost management from a monthly financial review into an integrated operational feedback loop, allowing engineering teams to evolve their AI investments from budget liabilities into sustainable competitive advantages that deliver a clear ROI.
AI infrastructure costs serious money, and companies won’t succeed if they’re not willing to spend it. The trick is to ensure that every dollar spent is accounted for and tied to measurable business value.