
Accelerating Revenue Growth, Expanding Margins and GAAP Profitability
Fourth Quarter $615 Million GAAP Net Revenue Up 35% Year-over-Year; $594 Million Adjusted Net Revenue Up 34% Year-over-Year
Record Fourth Quarter Adjusted EBITDA of $181 Million Up 159% Year-over-Year, 30% Target Margin Reached
Fourth Quarter Positive GAAP Net Income of $48 Million, GAAP EPS of $0.02
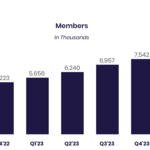
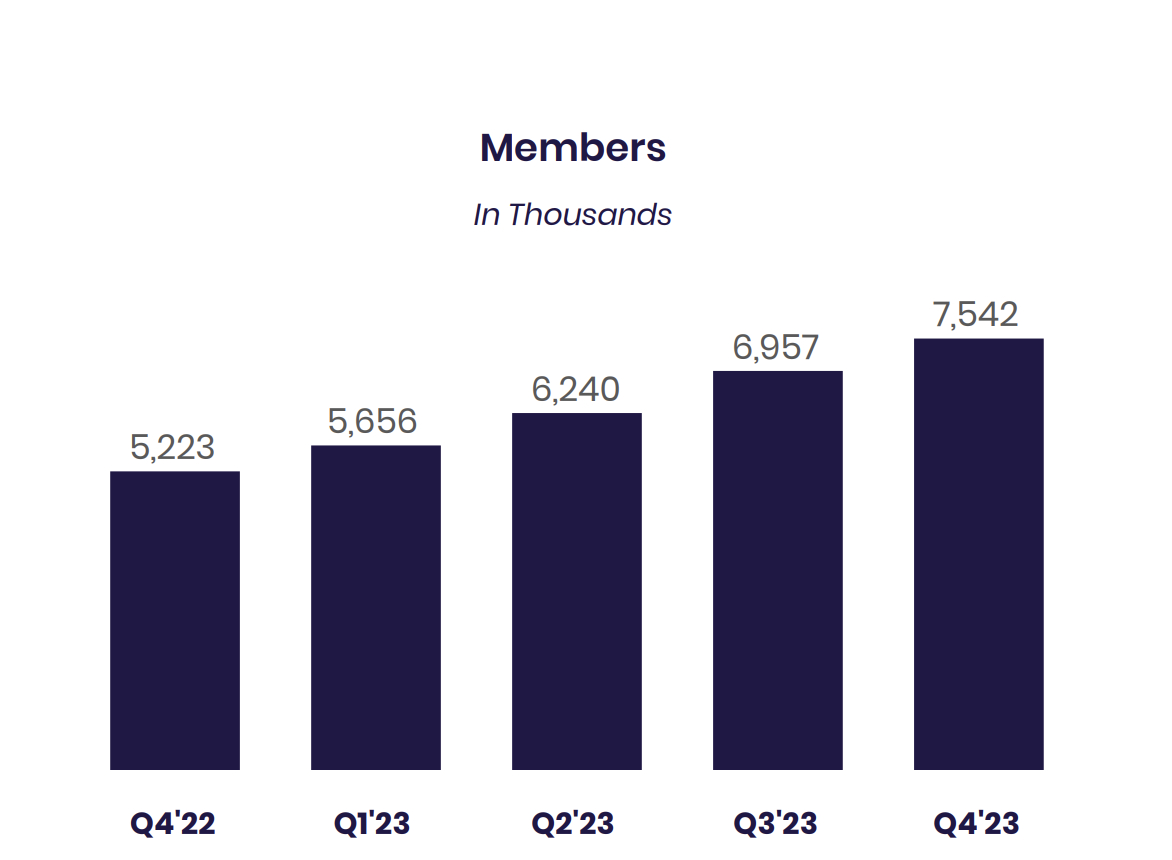
Quarterly New Member Adds of Nearly 585,000; Total Members Up 44% Year-over-Year to Over 7.5 Million
Quarterly New Product Adds of Nearly 695,000; Total Products Up 41% Year-over-Year to Over 11.1 Million
Fourth Quarter Total Deposit Growth of $2.9 Billion to $18.6 Billion
Fourth Quarter Growth in Tangible Book Value of $204 Million, up $334 Million for Full Year 2023
Diversification Milestone with 40% of Fourth Quarter Adjusted Net Revenue from Tech Platform and Financial Services Segments
Management Announces 2024 Guidance & Longer Term Outlook
SAN FRANCISCO–(BUSINESS WIRE)–SoFi Technologies, Inc. (NASDAQ: SOFI), a member-centric, one-stop shop for digital financial services that helps members borrow, save, spend, invest and protect their money, reported financial results today for its fourth quarter and fiscal year ended December 31, 2023.
![]()
![]()
“We delivered another quarter of record financial results and generated our eleventh consecutive quarter of record adjusted net revenue of $594 million. We saw new member adds of nearly 585,000 and growth of 44% for total period end members of over 7.5 million, with new product adds of nearly 695,000 and growth of 41% to over 11 million total products at period end. Record revenue at the company level was driven by record revenue across all three of our business segments, with a record contribution of 40% of adjusted net revenue generated by our non-Lending segments (Technology Platform and Financial Services segments). On a consolidated level, we saw sequential and year-over-year expansion of our net interest margin to 6.02%. We also generated record adjusted EBITDA of $181 million, representing 159% year-over-year growth and a 74% incremental adjusted EBITDA margin, with all three segments profitable on a contribution basis. This equates to a 30% adjusted EBITDA margin, in line with our long-term target. We generated positive GAAP net income of $48 million in the quarter and EPS of $0.02. Finally, we generated $204 million in tangible book value growth in the quarter and $334 million for all of 2023,” said Anthony Noto, CEO of SoFi Technologies, Inc.
Consolidated Results Summary
|
|
|
Three Months Ended December 31, |
|
% Change |
|
Year Ended December 31, |
|
% Change |
||||||||||||
|
($ in thousands, except per share amounts) |
|
2023 |
|
2022 |
|
|
2023 |
|
2022 |
|
||||||||||
|
Consolidated – GAAP |
|
|
|
|
|
|
|
|
|
|
|
|
||||||||
|
Total net revenue |
|
$ |
615,404 |
|
$ |
456,679 |
|
|
35% |
|
$ |
2,122,789 |
|
|
$ |
1,573,535 |
|
|
35 |
% |
|
Net income (loss) |
|
|
47,913 |
|
|
(40,006 |
) |
|
n/m |
|
|
(300,742 |
) |
|
|
(320,407 |
) |
|
(6 |
)% |
|
Net income (loss) attributable to common stockholders – basic(1) |
|
|
37,724 |
|
|
(50,195 |
) |
|
n/m |
|
|
(341,167 |
) |
|
|
(360,832 |
) |
|
(5 |
)% |
|
Net income (loss) attributable to common stockholders – diluted(1)(2) |
|
|
24,615 |
|
|
(50,195 |
) |
|
n/m |
|
|
(341,167 |
) |
|
|
(360,832 |
) |
|
(5 |
)% |
|
Earnings (loss) per share attributable to common stockholders – basic(1) |
|
|
0.04 |
|
|
(0.05 |
) |
|
n/m |
|
|
(0.36 |
) |
|
|
(0.40 |
) |
|
(10 |
)% |
|
Earnings (loss) per share attributable to common stockholders – diluted(1)(2) |
|
|
0.02 |
|
|
(0.05 |
) |
|
n/m |
|
|
(0.36 |
) |
|
|
(0.40 |
) |
|
(10 |
)% |
|
Consolidated – Non-GAAP |
|
|
|
|
|
|
|
|
|
|
|
|
||||||||
|
Adjusted net revenue(3) |
|
$ |
594,245 |
|
$ |
443,418 |
|
|
34% |
|
$ |
2,073,940 |
|
|
$ |
1,540,492 |
|
|
35 |
% |
|
Adjusted EBITDA(3) |
|
|
181,204 |
|
|
70,060 |
|
|
159% |
|
|
431,737 |
|
|
|
143,346 |
|
|
201 |
% |
|
Net income (loss), excluding impact of goodwill impairment(4) |
|
|
47,913 |
|
|
(40,006 |
) |
|
n/m |
|
|
(53,568 |
) |
|
|
(320,407 |
) |
|
(83 |
)% |
|
Net income (loss) attributable to common stockholders, excluding impact of goodwill impairment – basic(1)(4) |
|
|
37,724 |
|
|
(50,195 |
) |
|
n/m |
|
|
(93,993 |
) |
|
|
(360,832 |
) |
|
(74 |
)% |
|
Net income (loss) attributable to common stockholders, excluding impact of goodwill impairment – diluted(1)(2)(4) |
|
|
24,615 |
|
|
(50,195 |
) |
|
n/m |
|
|
(93,993 |
) |
|
|
(360,832 |
) |
|
(74 |
)% |
|
Earnings (loss) per share attributable to common stockholders, excluding impact of goodwill impairment – basic(1)(4) |
|
|
0.04 |
|
|
(0.05 |
) |
|
n/m |
|
|
(0.10 |
) |
|
|
(0.40 |
) |
|
(75 |
)% |
|
Earnings (loss) per share attributable to common stockholders, excluding impact of goodwill impairment – diluted(1)(2)(4) |
|
|
0.02 |
|
|
(0.05 |
) |
|
n/m |
|
|
(0.10 |
) |
|
|
(0.40 |
) |
|
(75 |
)% |
|
Tangible book value (as of period end)(5) |
|
|
3,477,059 |
|
|
3,142,956 |
|
|
11% |
|
|
3,477,059 |
|
|
|
3,142,956 |
|
|
11 |
% |
|
(1) |
|
For additional information on the computation of basic and diluted earnings (loss) per share, see Table 8 in the “Financial Tables” herein. |
|
(2) |
|
For the three months ended December 31, 2023, diluted earnings per share of $0.02 and diluted net income attributable to common stockholders of $24,615 exclude gain on extinguishment of debt and interest expense incurred, net of tax, associated with convertible note activity during the period. |
|
(3) |
|
Adjusted net revenue and adjusted EBITDA are non-GAAP financial measures. For more information and reconciliations to the most comparable GAAP measures, see “Non-GAAP Financial Measures” and Table 2 to the “Financial Tables” herein. |
|
(4) |
|
Earnings (loss) per share attributable to common stockholders, excluding impact of goodwill impairment is defined as net income (loss) attributable to common stockholders, adjusted to exclude goodwill impairment losses of $247.2 million for the year ended December 31, 2023, divided by the weighted average common stock outstanding. The goodwill impairment adjustment had no impact on weighted average common stock outstanding, or income tax impacts. |
|
(5) |
|
Defined as permanent equity, adjusted to exclude goodwill and intangible assets. |
Noto continued: “Continued growth of over 40% in both total members and products, along with improving operating efficiency, reflects the benefits of our broad product suite and unique Financial Services Productivity Loop (FSPL) strategy.”
Noto concluded: “Total deposits grew by $2.9 billion, up 19% during the fourth quarter to $18.6 billion at year-end, and over 90% of SoFi Money deposits (inclusive of Checking and Savings and cash management accounts) are from direct deposit members. For new direct deposit accounts opened in the fourth quarter, the median FICO score was 744. More than half of newly funded SoFi Money accounts are setting up direct deposit by day 30, which has had a significant impact on debit spending, which exceeded $1.5 billion in quarterly debit transaction volume and was up nearly threefold year-over-year, representing more than $6 billion of annualized debit transaction volume. Importantly, and as anticipated, we also benefit from continued strong cross-buy trends from this attractive member base into Lending and other Financial Services products.
“As a result of this growth in high quality deposits, we have benefited from a lower cost of funding for our loans. Our deposit funding also increases our flexibility to capture additional net interest margin (NIM) and optimize returns, a critical advantage in light of notable macroeconomic uncertainty. SoFi Bank, N.A. generated $128.6 million of GAAP net income at a 27% margin in the quarter, and an annualized return on tangible equity of 16.8%.”
Consolidated Results
Fourth quarter and full-year 2023 total GAAP net revenue of $615.4 million and $2.1 billion, respectively, each increased 35% relative to the prior-year period’s $456.7 million and $1.6 billion. Fourth quarter and full-year 2023 adjusted net revenue of $594.2 million and $2.1 billion grew 34% and 35%, respectively, from the corresponding prior-year periods of $443.4 million and $1.5 billion. Fourth quarter record adjusted EBITDA of $181.2 million increased 159% from the same prior year period’s $70.1 million, culminating in full-year positive adjusted EBITDA of $431.7 million, up 201% year-over-year.
SoFi reported a number of key financial achievements in the quarter, including positive GAAP net income of $47.9 million or $0.02 per share. This compares to a loss of $40.0 million in the fourth quarter of 2022. Full-year 2023 GAAP net loss, excluding the impact of impairment of goodwill assets, was $53.6 million, versus a loss of $320.4 million for full-year 2022.
Additionally, contribution profit in the Financial Services segment of $25.1 million increased nearly eightfold from the first quarter of positive contribution profit in the third quarter of 2023, while contribution margin grew 15 percentage points sequentially to 18%. The Financial Services segment also reached contribution profit break even for the full year 2023, relative to a loss of $199 million in 2022. This is a strong testament of our ability to scale new businesses from a significant investment phase to profitability via a continuous process of optimizing unit economics and efficiently acquiring members and achieving cross buy.
Net interest income of $389.6 million and $1.3 billion for the fourth quarter and full-year 2023, respectively, was up 87% and 116% from the corresponding prior-year periods and up 13% sequentially. Net interest margin of 6.02% was a record for the company, up from 5.99% last quarter and 5.94% in the prior-year quarter.
The average rate on interest-earning assets increased by 17 basis points sequentially and 122 basis points versus the prior-year period, while the average rate on interest-bearing liabilities increased just 9 basis points sequentially and 91 basis points year-over-year. The funding of loans continued to shift toward deposits. In the fourth quarter, the average rate on deposits was 218 basis points lower than that of warehouse facilities.
Technology Platform revenue of $96.9 million accelerated to 13% growth year-over-year, up from 6% year-over-year growth last quarter, with margins of 32% up 12 percentage points versus the prior year quarter.
Member and Product Growth
SoFi achieved strong year-over-year growth in both members and products in the fourth quarter and full-year 2023. New member additions of nearly 585,000 in the quarter brought total members to over 7.5 million by year end, up over 2.3 million, or 44%, from the prior year end.
Product additions of nearly 695,000 in the fourth quarter brought total products to over 11.1 million at year end, up 41% from 7.9 million at the prior year end.
In the Financial Services segment, total products increased by 45% year-over-year, to 9.5 million from 6.6 million at the prior year end. SoFi Money (inclusive of Checking and Savings and cash management accounts) grew 54% year-over-year to 3.4 million products, SoFi Relay grew 74% year-over-year to 3.3 million products and SoFi Invest grew 10% year-over-year to 2.4 million products.
Lending products increased 24% year-over-year to 1.7 million products, driven primarily by continued growth in personal loan products as well as a notable increase in student loan products.
Technology Platform enabled accounts increased by 11% year-over-year to 145 million.
Lending Segment Results
Lending segment GAAP and adjusted net revenues were $353.1 million and $346.5 million, respectively, for the fourth quarter of 2023, up 8% and 10%, respectively, and were $1.4 billion and $1.3 billion, respectively, for the full-year 2023, up 20% and 21%, respectively. Higher loan balances and net interest margin expansion drove strong growth in net interest income of $79.0 million, or 43%, and $429.3 million, or 81%, for the quarter and full-year 2023, respectively. Resulting net interest income of $262.6 million and $960.8 million significantly exceeded directly attributable segment expenses of $120.4 million and $513.1 million for the fourth quarter and full-year 2023, respectively.
Lending segment fourth quarter and full-year 2023 contribution profit of $226.1 million and $823.3 million increased 8% and 24%, respectively, from $208.8 million and $664.0 million in the corresponding prior-year periods. Contribution margin using Lending adjusted net revenue for the fourth quarter and full-year 2023 decreased to 65% from 66%, and increased to 62% from 60%, respectively, compared to the corresponding prior-year periods. These strong margins reflect SoFi’s ability to capitalize on continued strong demand for its lending products.
|
Lending – Segment Results of Operations |
||||||||||||||||||||||
|
|
|
Three Months Ended December 31, |
|
|
|
Year Ended December 31, |
|
|
||||||||||||||
|
($ in thousands) |
|
2023 |
|
2022 |
|
% Change |
|
2023 |
|
2022 |
|
% Change |
||||||||||
|
Net interest income |
|
$ |
262,626 |
|
|
$ |
183,607 |
|
|
43 |
% |
|
$ |
960,773 |
|
|
$ |
531,480 |
|
|
81 |
% |
|
Noninterest income |
|
|
90,500 |
|
|
|
144,584 |
|
|
(37 |
)% |
|
|
409,848 |
|
|
|
608,511 |
|
|
(33 |
)% |
|
Total net revenue – Lending |
|
|
353,126 |
|
|
|
328,191 |
|
|
8 |
% |
|
|
1,370,621 |
|
|
|
1,139,991 |
|
|
20 |
% |
|
Servicing rights – change in valuation inputs or assumptions |
|
|
(6,595 |
) |
|
|
(12,791 |
) |
|
(48 |
)% |
|
|
(34,700 |
) |
|
|
(39,651 |
) |
|
(12 |
)% |
|
Residual interests classified as debt – change in valuation inputs or assumptions |
|
|
10 |
|
|
|
(470 |
) |
|
n/m |
|
|
425 |
|
|
|
6,608 |
|
|
(94 |
)% |
|
|
Directly attributable expenses |
|
|
(120,431 |
) |
|
|
(106,131 |
) |
|
13 |
% |
|
|
(513,073 |
) |
|
|
(442,945 |
) |
|
16 |
% |
|
Contribution profit |
|
$ |
226,110 |
|
|
$ |
208,799 |
|
|
8 |
% |
|
$ |
823,273 |
|
|
$ |
664,003 |
|
|
24 |
% |
|
|
|
|
|
|
|
|
|
|
|
|
|
|
||||||||||
|
Adjusted net revenue – Lending(1) |
|
$ |
346,541 |
|
|
$ |
314,930 |
|
|
10 |
% |
|
$ |
1,336,346 |
|
|
$ |
1,106,948 |
|
|
21 |
% |
| (1) |
Adjusted net revenue – Lending represents a non-GAAP financial measure. For more information and a reconciliation to the most comparable GAAP measure, see “Non-GAAP Financial Measures” and Table 2 to the “Financial Tables” herein. |
|
Lending – Loans At Fair Value |
|||||||||||||
|
($ in thousands) |
Personal Loans |
|
Student Loans |
|
Home Loans |
|
Total |
||||||
|
December 31, 2023 |
|
|
|
|
|
|
|
||||||
|
Unpaid principal |
$ |
14,498,629 |
|
$ |
6,445,586 |
|
$ |
67,406 |
|
|
$ |
21,011,621 |
|
|
Accumulated interest |
|
114,541 |
|
|
34,357 |
|
|
92 |
|
|
|
148,990 |
|
|
Cumulative fair value adjustments(1) |
|
717,403 |
|
|
245,541 |
|
|
(1,300 |
) |
|
|
961,644 |
|
|
Total fair value of loans(2)(3) |
$ |
15,330,573 |
|
$ |
6,725,484 |
|
$ |
66,198 |
|
|
$ |
22,122,255 |
|
|
September 30, 2023 |
|
|
|
|
|
|
|
||||||
|
Unpaid principal |
$ |
14,177,004 |
|
$ |
5,929,047 |
|
$ |
110,320 |
|
|
$ |
20,216,371 |
|
|
Accumulated interest |
|
105,156 |
|
|
26,497 |
|
|
163 |
|
|
|
131,816 |
|
|
Cumulative fair value adjustments(1) |
|
568,836 |
|
|
86,000 |
|
|
(9,187 |
) |
|
|
645,649 |
|
|
Total fair value of loans(2)(3) |
$ |
14,850,996 |
|
$ |
6,041,544 |
|
$ |
101,296 |
|
|
$ |
20,993,836 |
|
| (1) |
During the three months ended December 31, 2023, the cumulative fair value adjustments for personal loans were primarily impacted by a lower discount rate, which resulted in higher fair value marks, partially offset by lower origination volume and higher prepayment rate and default rate assumptions. The cumulative fair value adjustments for student loans were primarily impacted by a lower discount rate and increases in coupon rates, which resulted in higher fair value marks, partially offset by lower origination volume and higher default rate assumption. |
|
| (2) |
Each component of the fair value of loans is impacted by charge-offs during the period. Our fair value assumption for annual default rate incorporates fair value markdowns on loans beginning when they are 10 days or more delinquent, with additional markdowns at 30, 60 and 90 days past due. |
|
| (3) |
As of December 31, 2023, student loans are classified as loans held for investment, and personal loans and home loans are classified as loans held for sale. As of September 30, 2023, all loans were classified as loans held for sale. |
The following table summarizes the significant inputs to the fair value model for personal and student loans:
|
|
Personal Loans |
|
Student Loans |
|||||
|
|
December 31, |
|
September 30, |
|
December 31, |
|
September 30, |
|
|
Weighted average coupon rate(1) |
13.8 % |
|
13.8 % |
|
5.6 % |
|
5.3 % |
|
|
Weighted average annual default rate |
4.8 % |
|
4.6 % |
|
0.6 % |
|
0.5 % |
|
|
Weighted average conditional prepayment rate |
23.2 % |
|
20.3 % |
|
10.5 % |
|
10.5 % |
|
|
Weighted average discount rate |
5.5 % |
|
6.6 % |
|
4.3 % |
|
4.8 % |
|
|
Benchmark rate(2) |
4.1 % |
|
5.0 % |
|
3.6 % |
|
4.5 % |
|
| (1) |
Represents the average coupon rate on loans held on balance sheet, weighted by unpaid principal balance outstanding at the balance sheet date. |
|
| (2) |
As of December 31, 2023 and September 30, 2023, corresponds with two-year SOFR for personal loans, and four-year SOFR for student loans. |
Fourth quarter Lending segment total origination volume increased 45% year-over-year, as a result of continued strong demand for personal loans and notable growth in both student loan and home loan originations.
Personal loan originations of $3.2 billion in the fourth quarter of 2023 were up 31% year-over-year, and declined 17% sequentially. Full year personal loan originations of $13.8 billion increased 41% from 2022. Fourth quarter student loan volume of nearly $790 million was up 95% year-over-year, and declined 14% sequentially. Fourth quarter home loan volume of $309 million was up 193% year-over-year, and declined 13% sequentially.
|
Lending – Originations and Average Balances |
||||||||||||||||||
|
|
|
Three Months Ended December 31, |
|
% Change |
|
Year Ended December 31, |
|
% Change |
||||||||||
|
|
|
2023 |
|
2022 |
|
|
2023 |
|
2022 |
|
||||||||
|
Origination volume ($ in thousands, during period) |
|
|
|
|
|
|
|
|
|
|
|
|
||||||
|
Personal loans |
|
$ |
3,222,759 |
|
$ |
2,466,093 |
|
31 |
% |
|
$ |
13,801,065 |
|
$ |
9,773,705 |
|
41 |
% |
|
Student loans |
|
|
789,970 |
|
|
405,789 |
|
95 |
% |
|
|
2,630,040 |
|
|
2,245,499 |
|
17 |
% |
|
Home loans |
|
|
308,884 |
|
|
105,501 |
|
193 |
% |
|
|
997,492 |
|
|
966,177 |
|
3 |
% |
|
Total |
|
$ |
4,321,613 |
|
$ |
2,977,383 |
|
45 |
% |
|
$ |
17,428,597 |
|
$ |
12,985,381 |
|
34 |
% |
|
Average loan balance ($, as of period end)(1) |
|
|
|
|
|
|
|
|
|
|
|
|
||||||
|
Personal loans |
|
$ |
24,223 |
|
$ |
24,917 |
|
(3 |
)% |
|
|
|
|
|
|
|||
|
Student loans |
|
|
44,683 |
|
|
46,585 |
|
(4 |
)% |
|
|
|
|
|
|
|||
|
Home loans |
|
|
284,289 |
|
|
285,152 |
|
— |
% |
|
|
|
|
|
|
|||
| (1) |
Within each loan product category, average loan balance is defined as the total unpaid principal balance of the loans divided by the number of loans that have a balance greater than zero dollars as of the reporting date. Average loan balance includes loans on the balance sheet and transferred loans with which SoFi has a continuing involvement through its servicing agreements. |
|
Lending – Products |
|
December 31, |
|
|
||
|
|
|
2023 |
|
2022 |
|
% Change |
|
Personal loans |
|
1,113,864 |
|
837,462 |
|
33 % |
|
Student loans |
|
519,489 |
|
477,132 |
|
9 % |
|
Home loans |
|
29,653 |
|
26,003 |
|
14 % |
|
Total lending products |
|
1,663,006 |
|
1,340,597 |
|
24 % |
Technology Platform Segment Results
Technology Platform segment record net revenue of $96.9 million for the fourth quarter of 2023 and $352.3 million for the full year increased 13% and 12% from the comparable prior year periods and 8% sequentially. Contribution profit of $30.6 million for the fourth quarter of 2023 and $94.8 million for the full year increased 81% and 24% from the comparable prior year periods, for a margin of 32% and 27%, respectively.
In the fourth quarter, growth was driven by continued strong organic growth of existing partners, new product adoption and notable contributions from increasingly diversified clients which have launched within the last 6 months. As noted previously, we continue to make significant strides in our strategy of leveraging our unique product suite to pursue diversified growth and larger, more durable revenue opportunities.
|
Technology Platform – Segment Results of Operations |
||||||||||||||||||||
|
|
|
Three Months Ended December 31, |
|
|
|
Year Ended December 31, |
|
|
||||||||||||
|
($ in thousands) |
|
2023 |
|
2022 |
|
% Change |
|
2023 |
|
2022 |
|
% Change |
||||||||
|
Net interest income |
|
$ |
941 |
|
|
$ |
— |
|
|
n/m |
|
$ |
1,514 |
|
|
$ |
— |
|
|
n/m |
|
Noninterest income |
|
|
95,966 |
|
|
|
85,652 |
|
|
12 % |
|
|
350,826 |
|
|
|
315,133 |
|
|
11 % |
|
Total net revenue – Technology Platform |
|
|
96,907 |
|
|
|
85,652 |
|
|
13 % |
|
|
352,340 |
|
|
|
315,133 |
|
|
12 % |
|
Directly attributable expenses |
|
|
(66,323 |
) |
|
|
(68,771 |
) |
|
(4)% |
|
|
(257,554 |
) |
|
|
(238,620 |
) |
|
8 % |
|
Contribution profit |
|
$ |
30,584 |
|
|
$ |
16,881 |
|
|
81 % |
|
$ |
94,786 |
|
|
$ |
76,513 |
|
|
24 % |
Technology Platform total enabled client accounts increased 11% year-over-year, to 145.4 million at December 31, 2023 from 130.7 million at December 31, 2022.
There is a robust pipeline of ongoing discussions with potential partners with large existing customer bases across both the U.S. and Latin America spanning both the financial services and non-financial services segments.
|
Technology Platform |
|
December 31, |
|
|
||
|
|
|
2023 |
|
2022 |
|
% Change |
|
Total accounts |
|
145,425,391 |
|
130,704,351 |
|
11 % |
Financial Services Segment Results
Financial Services segment record net revenue increased 115% in the fourth quarter of 2023 to $139.1 million from the prior year period’s total of $64.8 million, and by 160% for the full year to $436.5 million in 2023, helped by 126% and 103% growth in segment interchange revenue and 139% and 262% growth in net interest income. Notably, the company exceeded $1.5 billion in point of sale debit transaction volume in the quarter, representing an annualized $6 billion run-rate. Strength in the segment results was driven by new all-time high revenue for SoFi Money, Credit Card and lending as a service, as well as continued contributions from SoFi Invest.
The Financial Services segment posted a positive contribution profit of $25.1 million for the fourth quarter and nearly broke even with a loss of $0.3 million for the full year of 2023, reflecting a $68.6 million and $199.2 million improvement over the comparable prior year periods of $43.6 million and $199.4 million losses. This came as a result of continued improvement in monetization for the segment, along with increasing operating leverage as we efficiently scale the business. Monetization progress is underscored by annualized revenue per product of $59 for the fourth quarter of 2023 and $46 for the full year, which grew 48% and 80% year-over-year and 10% sequentially. At the same time, operating leverage is evident, as the segment generated $74.3 million in incremental revenue, with only $5.7 million in incremental directly attributable expenses year-over-year, driving a 92.4% incremental contribution profit margin.
|
Financial Services – Segment Results of Operations |
||||||||||||||||||||
|
|
|
Three Months Ended December 31, |
|
|
|
Year Ended December 31, |
|
|
||||||||||||
|
($ in thousands) |
|
2023 |
|
2022 |
|
% Change |
|
2023 |
|
2022 |
|
% Change |
||||||||
|
Net interest income |
|
$ |
109,072 |
|
|
$ |
45,609 |
|
|
139 % |
|
$ |
334,847 |
|
|
$ |
92,574 |
|
|
262 % |
|
Noninterest income |
|
|
30,043 |
|
|
|
19,208 |
|
|
56 % |
|
|
101,668 |
|
|
|
75,102 |
|
|
35 % |
|
Total net revenue – Financial Services |
|
|
139,115 |
|
|
|
64,817 |
|
|
115 % |
|
|
436,515 |
|
|
|
167,676 |
|
|
160 % |
|
Directly attributable expenses |
|
|
(114,055 |
) |
|
|
(108,405 |
) |
|
5 % |
|
|
(436,777 |
) |
|
|
(367,102 |
) |
|
19 % |
|
Contribution profit (loss) |
|
$ |
25,060 |
|
|
$ |
(43,588 |
) |
|
n/m |
|
$ |
(262 |
) |
|
$ |
(199,426 |
) |
|
(100)% |
By continuously innovating with new and relevant offerings, features and rewards for members, SoFi grew total Financial Services products by over 2.9 million, or 45%, year-over-year, bringing the total to 9.5 million at year end. In the fourth quarter of 2023, SoFi Money products increased by nearly 311,000, and Relay products increased by over 378,000. SoFi Invest products decreased by 84,000, but when adjusted to exclude the accounts of our now closed digital assets business, products increased by over 113,000 in the quarter.
Most notably, our SoFi Money offering has an APY of up to 4.60% as of January 29, 2024, no minimum balance requirement nor balance limits, FDIC insurance through a network of participating banks of up to $2 million, a host of free features and a unique rewards program. Total deposits grew 19% during the fourth quarter to $18.6 billion at year end, and over 90% of SoFi Money deposits (inclusive of Checking and Savings and cash management accounts) are from direct deposit members. More than half of newly funded SoFi Money accounts were setting up direct deposit by day 30 in the fourth quarter of 2023.
|
Financial Services – Products |
|
December 31, |
|
|
||
|
|
|
2023 |
|
2022 |
|
% Change |
|
Money(1) |
|
3,374,310 |
|
2,195,402 |
|
54 % |
|
Invest |
|
2,380,641 |
|
2,158,864 |
|
10 % |
|
Credit Card |
|
245,385 |
|
171,425 |
|
43 % |
|
Referred loans(2) |
|
55,231 |
|
40,980 |
|
35 % |
|
Relay |
|
3,336,868 |
|
1,921,986 |
|
74 % |
|
At Work |
|
87,035 |
|
65,382 |
|
33 % |
|
Total financial services products |
|
9,479,470 |
|
6,554,039 |
|
45 % |
Contacts
Investors:
SoFi Investor Relations
[email protected]
Media:
SoFi Media Relations
[email protected]