March Core Net New Assets Equal $59.1 Billion, 1Q25 Totals $137.7 Billion
1Q25 Net Revenues Up 18% Year-Over-Year to a Record $5.6 Billion
Quarterly GAAP Earnings Per Share of $.99, $1.04 Adjusted (1) – Up 41% Versus 1Q24
WESTLAKE, Texas–(BUSINESS WIRE)–The Charles Schwab Corporation reported net income for the first quarter totaling $1.9 billion, or $.99 earnings per share. Excluding $130 million of pre-tax transaction-related costs, adjusted (1) net income and earnings per share equaled $2.0 billion and $1.04, respectively.


|
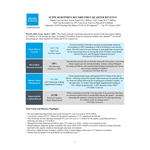
Client Driven |
|
$137.7B |
“Investors turned to Schwab to navigate an increasingly uncertain environment in 1Q25, entrusting us with $138 billion in core net new assets. This 44% year-over-year increase in asset gathering was powered by our unwavering focus on serving the needs of clients across Retail, Advisor Services, and Workplace Financial Services.” President & CEO Rick Wurster |
|
|
|
|
|
|
|
|
Diversified |
|
18% |
“Schwab delivered growth on all fronts during the first quarter, converting robust organic growth, increased trading volumes, strong Managed Investing net inflows, and sustained bank lending momentum into record net revenues totaling $5.6 billion.” President & CEO Rick Wurster |
|
|
|
|
|
|
|
|
Balance Sheet |
|
$11.8B |
“Client transactional sweep cash equaled $407.8 billion at the end of March – reflecting normal first quarter deployment activity partially offset by client net selling following the re-emergence of market volatility. At the same time, we further reduced Bank Supplemental Funding to $38.1 billion at quarter-end – a 46% decrease versus 1Q24.” CFO Mike Verdeschi |
|
|
|
|
|
|
|
|
Opportunistic |
|
$1.5B |
“While continuing to meet the evolving needs of our growing client base, we increased capital return to stockholders during the quarter – including increasing the quarterly common dividend by 8% and repurchasing $1.5 billion worth of common stock.” CFO Mike Verdeschi |
1Q25 Client and Business Highlights
- Net asset gathering helped total client assets increase 9% year-over-year to $9.93 trillion
- Core net new assets of $137.7 billion for the quarter represents a 5.5% annualized growth rate
- New brokerage account openings increased 8% year-over-year to 1.2 million for the quarter, propelling total active brokerage accounts to 37.0 million
- Managed Investing Solutions net inflows grew 15% relative to 1Q24 – setting a new quarterly record
- Margin balances ended the quarter essentially flat versus 4Q24 at $83.6 billion, as investors reduced leverage during the back half of the quarter amidst an increasingly uncertain environment
- Driven by a sharp increase in market volatility, daily average trading volume grew 17% quarter-over-quarter
- Charles Schwab named #1 Overall Broker by StockBrokers.com (3)
|
|
Three Months Ended |
|
% |
||||||||
|
Financial Highlights |
2025 |
|
2024 |
|
Change |
||||||
|
|
|
|
|
|
|
||||||
|
Net revenues (in millions) |
$ |
5,599 |
|
|
$ |
4,740 |
|
|
18 |
% |
|
|
Net income (in millions) |
|
|
|
|
|
||||||
|
GAAP |
$ |
1,909 |
|
|
$ |
1,362 |
|
|
40 |
% |
|
|
Adjusted |
$ |
2,008 |
|
|
$ |
1,469 |
|
|
37 |
% |
|
|
Diluted earnings per common share |
|
|
|
|
|
||||||
|
GAAP |
$ |
.99 |
|
|
$ |
.68 |
|
|
46 |
% |
|
|
Adjusted |
$ |
1.04 |
|
|
$ |
.74 |
|
|
41 |
% |
|
|
Pre-tax profit margin |
|
|
|
|
|
||||||
|
GAAP |
|
43.8 |
% |
|
|
37.9 |
% |
|
|
||
|
Adjusted |
|
46.2 |
% |
|
|
40.9 |
% |
|
|
||
|
Return on average common stockholders’ equity (annualized) |
|
18 |
% |
|
|
15 |
% |
|
|
||
|
Return on tangible common equity (annualized) |
|
35 |
% |
|
|
39 |
% |
|
|
||
|
Note: |
Items labeled “adjusted” are non-GAAP financial measures; further details are included on pages 10-12 of this release. All per-share results are rounded to the nearest cent, based on weighted-average diluted common shares outstanding. |
1Q25 Financial Commentary
- Quarterly net revenues grew year-over-year by 18% to a record $5.6 billion
- Net interest margin expanded sequentially by 20 basis points to 2.53%
- Client transactional sweep cash balances ended at $407.8 billion, a sequential decline of $10.8 billion, reflecting typical first quarter seasonality as well as client net equity selling during the back half of the quarter
- Bank Supplemental Funding (2) declined $11.8 billion during the quarter to $38.1 billion at March month-end
- Asset management and administration fees increased by 14% year-over-year to $1.5 billion as organic growth and product utilization more than offset the impact of recent equity market weakness
- Trading revenue increased 11% versus 1Q24 due to higher volumes
- GAAP expenses for the quarter increased 7% versus 1Q24; excluding first quarter amortization of acquired intangibles of $130 million, adjusted total expenses (1) were up 8% year-over-year
- Capital ratios across the firm continued to strengthen – including preliminary consolidated Tier 1 Leverage and adjusted Tier 1 Leverage (1) reaching 9.9% and 7.1%, respectively
- Increased the quarterly common stock dividend by 8% to $.27 per share
- Repurchased 19.2 million shares of our common stock for $1.5 billion in connection with The Toronto-Dominion Bank’s secondary offer
|
(1) |
Further details on non-GAAP financial measures and a reconciliation of such measures to GAAP reported results are included on pages 10-12 of this release. |
|
|
(2) |
Bank Supplemental Funding includes repurchase agreements at the banks, Schwab Bank Certificates of Deposit (CDs), and Federal Home Loan Bank balances. |
|
|
(3) |
StockBrokers.com Annual Awards 2025 was given on January 28, 2025. The criteria, evaluation, and ranking were determined by StockBrokers.com. Companies were assessed in StockBrokers.com’s 7 Primary Categories: Range of Investments, Platforms & Tools, Research, Mobile Trading, Education, Ease of Use, and Overall. See https://www.stockbrokers.com/annual-awards-2025 for more information. |
Spring Business Update
The company will host its Spring Business Update for institutional investors this morning from 7:30 a.m. – 8:30 a.m. CT, 8:30 a.m. – 9:30 a.m. ET.
Registration for this Update webcast is accessible at https://www.aboutschwab.com/schwabevents.
Forward-Looking Statements
This press release contains forward-looking statements relating to the company’s business results and capital ratios. These forward-looking statements reflect management’s expectations as of the date hereof. Achievement of these expectations and objectives is subject to risks and uncertainties that could cause actual results to differ materially from the expressed expectations. Important factors that may cause such differences are described in the company’s most recent reports on Form 10-K and Form 10-Q, which have been filed with the Securities and Exchange Commission and are available on the company’s website (https://www.aboutschwab.com/financial-reports) and on the Securities and Exchange Commission’s website (https://www.sec.gov). The company makes no commitment to update any forward-looking statements.
About Charles Schwab
The Charles Schwab Corporation (NYSE: SCHW) is a leading provider of financial services, with 37.0 million active brokerage accounts, 5.5 million workplace plan participant accounts, 2.1 million banking accounts, and $9.93 trillion in client assets. Through its operating subsidiaries, the company provides a full range of wealth management, securities brokerage, banking, asset management, custody, and financial advisory services to individual investors and independent investment advisors. Its broker-dealer subsidiary, Charles Schwab & Co., Inc. (member SIPC, https://www.sipc.org), and its affiliates offer a complete range of investment services and products including an extensive selection of mutual funds; financial planning and investment advice; retirement plan and equity compensation plan services; referrals to independent, fee-based investment advisors; and custodial, operational and trading support for independent, fee-based investment advisors through Schwab Advisor Services. Its primary banking subsidiary, Charles Schwab Bank, SSB (member FDIC and an Equal Housing Lender), provides banking and lending services and products. More information is available at https://www.aboutschwab.com.
|
THE CHARLES SCHWAB CORPORATION |
||||||||
|
Consolidated Statements of Income |
||||||||
|
(In millions, except per share amounts) |
||||||||
|
(Unaudited) |
||||||||
|
|
Three Months Ended |
|||||||
|
|
2025 |
|
2024 |
|||||
|
Net Revenues |
|
|
|
|||||
|
Interest revenue |
$ |
3,757 |
|
|
$ |
3,941 |
|
|
|
Interest expense |
|
(1,051 |
) |
|
|
(1,708 |
) |
|
|
Net interest revenue |
|
2,706 |
|
|
|
2,233 |
|
|
|
Asset management and administration fees |
|
1,530 |
|
|
|
1,348 |
|
|
|
Trading revenue |
|
908 |
|
|
|
817 |
|
|
|
Bank deposit account fees |
|
245 |
|
|
|
183 |
|
|
|
Other |
|
210 |
|
|
|
159 |
|
|
|
Total net revenues |
|
5,599 |
|
|
|
4,740 |
|
|
|
Expenses Excluding Interest |
|
|
|
|||||
|
Compensation and benefits |
|
1,672 |
|
|
|
1,538 |
|
|
|
Professional services |
|
269 |
|
|
|
241 |
|
|
|
Occupancy and equipment |
|
274 |
|
|
|
265 |
|
|
|
Advertising and market development |
|
96 |
|
|
|
88 |
|
|
|
Communications |
|
153 |
|
|
|
141 |
|
|
|
Depreciation and amortization |
|
217 |
|
|
|
228 |
|
|
|
Amortization of acquired intangible assets |
|
130 |
|
|
|
130 |
|
|
|
Regulatory fees and assessments |
|
89 |
|
|
|
125 |
|
|
|
Other |
|
244 |
|
|
|
186 |
|
|
|
Total expenses excluding interest |
|
3,144 |
|
|
|
2,942 |
|
|
|
Income before taxes on income |
|
2,455 |
|
|
|
1,798 |
|
|
|
Taxes on income |
|
546 |
|
|
|
436 |
|
|
|
Net Income |
|
1,909 |
|
|
|
1,362 |
|
|
|
Preferred stock dividends and other |
|
113 |
|
|
|
111 |
|
|
|
Net Income Available to Common Stockholders |
$ |
1,796 |
|
|
$ |
1,251 |
|
|
|
Weighted-Average Common Shares Outstanding: |
|
|
|
|||||
|
Basic |
|
1,817 |
|
|
|
1,825 |
|
|
|
Diluted |
|
1,822 |
|
|
|
1,831 |
|
|
|
Earnings Per Common Shares Outstanding: |
|
|
|
|||||
|
Basic |
$ |
.99 |
|
|
$ |
.69 |
|
|
|
Diluted |
$ |
.99 |
|
|
$ |
.68 |
|
|
|
THE CHARLES SCHWAB CORPORATION |
|||||||||||||||||||||||||||
|
Financial and Operating Highlights |
|||||||||||||||||||||||||||
|
(Unaudited) |
|||||||||||||||||||||||||||
|
|
Q1-25 % change |
|
2025 |
|
2024 |
||||||||||||||||||||||
|
|
vs. |
|
vs. |
|
|
First |
|
Fourth |
|
Third |
|
Second |
|
First |
|||||||||||||
|
(In millions, except per share amounts and as noted) |
Q1-24 |
|
Q4-24 |
|
|
Quarter |
|
Quarter |
|
Quarter |
|
Quarter |
|
Quarter |
|||||||||||||
|
Net Revenues |
|
|
|
|
|
|
|
|
|
|
|
|
|
|
|||||||||||||
|
Net interest revenue |
21 |
% |
|
7 |
% |
|
|
$ |
2,706 |
|
|
$ |
2,531 |
|
|
$ |
2,222 |
|
|
$ |
2,158 |
|
|
$ |
2,233 |
|
|
|
Asset management and administration fees |
14 |
% |
|
1 |
% |
|
|
|
1,530 |
|
|
|
1,509 |
|
|
|
1,476 |
|
|
|
1,383 |
|
|
|
1,348 |
|
|
|
Trading revenue |
11 |
% |
|
4 |
% |
|
|
|
908 |
|
|
|
873 |
|
|
|
797 |
|
|
|
777 |
|
|
|
817 |
|
|
|
Bank deposit account fees |
34 |
% |
|
2 |
% |
|
|
|
245 |
|
|
|
241 |
|
|
|
152 |
|
|
|
153 |
|
|
|
183 |
|
|
|
Other |
32 |
% |
|
20 |
% |
|
|
|
210 |
|
|
|
175 |
|
|
|
200 |
|
|
|
219 |
|
|
|
159 |
|
|
|
Total net revenues |
18 |
% |
|
5 |
% |
|
|
|
5,599 |
|
|
|
5,329 |
|
|
|
4,847 |
|
|
|
4,690 |
|
|
|
4,740 |
|
|
|
Expenses Excluding Interest |
|
|
|
|
|
|
|
|
|
|
|
|
|
|
|||||||||||||
|
Compensation and benefits |
9 |
% |
|
9 |
% |
|
|
|
1,672 |
|
|
|
1,533 |
|
|
|
1,522 |
|
|
|
1,450 |
|
|
|
1,538 |
|
|
|
Professional services |
12 |
% |
|
(9 |
)% |
|
|
|
269 |
|
|
|
297 |
|
|
|
256 |
|
|
|
259 |
|
|
|
241 |
|
|
|
Occupancy and equipment |
3 |
% |
|
(1 |
)% |
|
|
|
274 |
|
|
|
276 |
|
|
|
271 |
|
|
|
248 |
|
|
|
265 |
|
|
|
Advertising and market development |
9 |
% |
|
(5 |
)% |
|
|
|
96 |
|
|
|
101 |
|
|
|
101 |
|
|
|
107 |
|
|
|
88 |
|
|
|
Communications |
9 |
% |
|
17 |
% |
|
|
|
153 |
|
|
|
131 |
|
|
|
147 |
|
|
|
172 |
|
|
|
141 |
|
|
|
Depreciation and amortization |
(5 |
)% |
|
(3 |
)% |
|
|
|
217 |
|
|
|
224 |
|
|
|
231 |
|
|
|
233 |
|
|
|
228 |
|
|
|
Amortization of acquired intangible assets |
— |
|
|
— |
|
|
|
|
130 |
|
|
|
130 |
|
|
|
130 |
|
|
|
129 |
|
|
|
130 |
|
|
|
Regulatory fees and assessments |
(29 |
)% |
|
— |
|
|
|
|
89 |
|
|
|
89 |
|
|
|
88 |
|
|
|
96 |
|
|
|
125 |
|
|
|
Other |
31 |
% |
|
— |
|
|
|
|
244 |
|
|
|
243 |
|
|
|
259 |
|
|
|
249 |
|
|
|
186 |
|
|
|
Total expenses excluding interest |
7 |
% |
|
4 |
% |
|
|
|
3,144 |
|
|
|
3,024 |
|
|
|
3,005 |
|
|
|
2,943 |
|
|
|
2,942 |
|
|
|
Income before taxes on income |
37 |
% |
|
7 |
% |
|
|
|
2,455 |
|
|
|
2,305 |
|
|
|
1,842 |
|
|
|
1,747 |
|
|
|
1,798 |
|
|
|
Taxes on income |
25 |
% |
|
17 |
% |
|
|
|
546 |
|
|
|
465 |
|
|
|
434 |
|
|
|
415 |
|
|
|
436 |
|
|
|
Net Income |
40 |
% |
|
4 |
% |
|
|
|
1,909 |
|
|
|
1,840 |
|
|
|
1,408 |
|
|
|
1,332 |
|
|
|
1,362 |
|
|
|
Preferred stock dividends and other |
2 |
% |
|
(8 |
)% |
|
|
|
113 |
|
|
|
123 |
|
|
|
109 |
|
|
|
121 |
|
|
|
111 |
|
|
|
Net Income Available to Common Stockholders |
44 |
% |
|
5 |
% |
|
|
$ |
1,796 |
|
|
$ |
1,717 |
|
|
$ |
1,299 |
|
|
$ |
1,211 |
|
|
$ |
1,251 |
|
|
|
Earnings per common share: |
|
|
|
|
|
|
|
|
|
|
|
|
|
|
|||||||||||||
|
Basic |
43 |
% |
|
5 |
% |
|
|
$ |
.99 |
|
|
$ |
.94 |
|
|
$ |
.71 |
|
|
$ |
.66 |
|
|
$ |
.69 |
|
|
|
Diluted |
46 |
% |
|
5 |
% |
|
|
$ |
.99 |
|
|
$ |
.94 |
|
|
$ |
.71 |
|
|
$ |
.66 |
|
|
$ |
.68 |
|
|
|
Dividends declared per common share |
8 |
% |
|
8 |
% |
|
|
$ |
.27 |
|
|
$ |
.25 |
|
|
$ |
.25 |
|
|
$ |
.25 |
|
|
$ |
.25 |
|
|
|
Weighted-average common shares outstanding: |
|
|
|
|
|
|
|
|
|
|
|
|
|
|
|||||||||||||
|
Basic |
— |
|
|
(1 |
)% |
|
|
|
1,817 |
|
|
|
1,831 |
|
|
|
1,829 |
|
|
|
1,828 |
|
|
|
1,825 |
|
|
|
Diluted |
— |
|
|
(1 |
)% |
|
|
|
1,822 |
|
|
|
1,836 |
|
|
|
1,834 |
|
|
|
1,834 |
|
|
|
1,831 |
|
|
|
Performance Measures |
|
|
|
|
|
|
|
|
|
|
|
|
|
|
|||||||||||||
|
Pre-tax profit margin |
|
|
|
|
|
|
43.8 |
% |
|
|
43.3 |
% |
|
|
38.0 |
% |
|
|
37.2 |
% |
|
|
37.9 |
% |
|||
|
Return on average common stockholders’ equity (annualized) (1) |
|
|
|
|
|
|
18 |
% |
|
|
18 |
% |
|
|
14 |
% |
|
|
14 |
% |
|
|
15 |
% |
|||
|
Financial Condition (at quarter end, in billions) |
|
|
|
|
|
|
|
|
|
|
|
|
|
|
|||||||||||||
|
Cash and cash equivalents |
10 |
% |
|
(17 |
)% |
|
|
$ |
35.0 |
|
|
$ |
42.1 |
|
|
$ |
34.9 |
|
|
$ |
25.4 |
|
|
$ |
31.8 |
|
|
|
Cash and investments segregated |
48 |
% |
|
1 |
% |
|
|
|
38.4 |
|
|
|
38.2 |
|
|
|
33.7 |
|
|
|
21.7 |
|
|
|
25.9 |
|
|
|
Receivables from brokers, dealers, and clearing organizations |
(29 |
)% |
|
21 |
% |
|
|
|
2.9 |
|
|
|
2.4 |
|
|
|
3.4 |
|
|
|
3.2 |
|
|
|
4.1 |
|
|
|
Receivables from brokerage clients — net |
19 |
% |
|
(1 |
)% |
|
|
|
84.4 |
|
|
|
85.4 |
|
|
|
74.0 |
|
|
|
72.8 |
|
|
|
71.2 |
|
|
|
Available for sale securities |
(26 |
)% |
|
(10 |
)% |
|
|
|
74.8 |
|
|
|
83.0 |
|
|
|
90.0 |
|
|
|
93.6 |
|
|
|
101.1 |
|
|
|
Held to maturity securities |
(8 |
)% |
|
(2 |
)% |
|
|
|
143.8 |
|
|
|
146.5 |
|
|
|
149.9 |
|
|
|
153.2 |
|
|
|
156.4 |
|
|
|
Bank loans — net |
15 |
% |
|
4 |
% |
|
|
|
47.1 |
|
|
|
45.2 |
|
|
|
43.3 |
|
|
|
42.2 |
|
|
|
40.8 |
|
|
|
Total assets |
(1 |
)% |
|
(4 |
)% |
|
|
|
462.9 |
|
|
|
479.8 |
|
|
|
466.1 |
|
|
|
449.7 |
|
|
|
468.8 |
|
|
|
Bank deposits |
(9 |
)% |
|
(5 |
)% |
|
|
|
246.2 |
|
|
|
259.1 |
|
|
|
246.5 |
|
|
|
252.4 |
|
|
|
269.5 |
|
|
|
Payables to brokers, dealers, and clearing organizations (2) |
134 |
% |
|
18 |
% |
|
|
|
15.7 |
|
|
|
13.3 |
|
|
|
16.4 |
|
|
|
5.9 |
|
|
|
6.7 |
|
|
|
Payables to brokerage clients |
20 |
% |
|
(1 |
)% |
|
|
|
100.6 |
|
|
|
101.6 |
|
|
|
89.2 |
|
|
|
80.0 |
|
|
|
84.0 |
|
|
|
Accrued expenses and other liabilities (2) |
1 |
% |
|
(11 |
)% |
|
|
|
11.0 |
|
|
|
12.3 |
|
|
|
11.2 |
|
|
|
10.6 |
|
|
|
10.9 |
|
|
|
Other short-term borrowings |
(18 |
)% |
|
15 |
% |
|
|
|
6.9 |
|
|
|
6.0 |
|
|
|
10.6 |
|
|
|
10.0 |
|
|
|
8.4 |
|
|
|
Federal Home Loan Bank borrowings |
(52 |
)% |
|
(31 |
)% |
|
|
|
11.5 |
|
|
|
16.7 |
|
|
|
22.6 |
|
|
|
24.4 |
|
|
|
24.0 |
|
|
|
Long-term debt |
(6 |
)% |
|
(4 |
)% |
|
|
|
21.5 |
|
|
|
22.4 |
|
|
|
22.4 |
|
|
|
22.4 |
|
|
|
22.9 |
|
|
|
Total liabilities |
(3 |
)% |
|
(4 |
)% |
|
|
|
413.4 |
|
|
|
431.5 |
|
|
|
418.8 |
|
|
|
405.7 |
|
|
|
426.4 |
|
|
|
Stockholders’ equity |
17 |
% |
|
2 |
% |
|
|
|
49.5 |
|
|
|
48.4 |
|
|
|
47.2 |
|
|
|
44.0 |
|
|
|
42.4 |
|
|
|
Total liabilities and stockholders’ equity |
(1 |
)% |
|
(4 |
)% |
|
|
|
462.9 |
|
|
|
479.8 |
|
|
|
466.1 |
|
|
|
449.7 |
|
|
|
468.8 |
|
|
|
Other |
|
|
|
|
|
|
|
|
|
|
|
|
|
|
|||||||||||||
|
Full-time equivalent employees (at quarter end, in thousands) |
(2 |
)% |
|
— |
|
|
|
|
32.1 |
|
|
|
32.1 |
|
|
|
32.1 |
|
|
|
32.3 |
|
|
|
32.6 |
|
|
|
Capital expenditures — purchases of equipment, office facilities, and property, net (in millions) |
28 |
% |
|
(40 |
)% |
|
|
$ |
156 |
|
|
$ |
258 |
|
|
$ |
135 |
|
|
$ |
92 |
|
|
$ |
122 |
|
|
|
Expenses excluding interest as a percentage of average client assets (annualized) |
|
|
|
|
|
|
0.12 |
% |
|
|
0.12 |
% |
|
|
0.12 |
% |
|
|
0.13 |
% |
|
|
0.14 |
% |
|||
|
Clients’ Daily Average Trades (DATs) (in thousands) |
24 |
% |
|
17 |
% |
|
|
|
7,391 |
|
|
|
6,312 |
|
|
|
5,697 |
|
|
|
5,486 |
|
|
|
5,958 |
|
|
|
Number of Trading Days |
(2 |
)% |
|
(5 |
)% |
|
|
|
60.0 |
|
|
|
63.0 |
|
|
|
63.5 |
|
|
|
63.0 |
|
|
|
61.0 |
|
|
|
Revenue Per Trade (3) |
(9 |
)% |
|
(7 |
)% |
|
|
$ |
2.05 |
|
|
$ |
2.20 |
|
|
$ |
2.20 |
|
|
$ |
2.25 |
|
|
$ |
2.25 |
|
|
|
|
|
|
|
|
|
|
|
|
|
|
|
|
|
|
|||||||||||||
|
(1) |
Return on average common stockholders’ equity is calculated using net income available to common stockholders divided by average common stockholders’ equity. |
|
|
(2) |
Beginning in the fourth quarter of 2024, payables to brokers, dealers, and clearing organizations are presented separately from accrued expenses and other liabilities. Prior period amounts have been reclassified to reflect this change. Payables to brokers, dealers, and clearing organizations include securities loaned. |
|
|
(3) |
Revenue per trade is calculated as trading revenue divided by the product of DATs multiplied by the number of trading days. |
|
|
THE CHARLES SCHWAB CORPORATION |
|||||||||||||||||||
|
Net Interest Revenue Information |
|||||||||||||||||||
|
(In millions, except ratios or as noted) |
|||||||||||||||||||
|
(Unaudited) |
|||||||||||||||||||
|
|
Three Months Ended |
||||||||||||||||||
|
|
2025 |
|
|
2024 |
|||||||||||||||
|
|
Average |
|
Interest |
|
Average |
|
|
Average |
|
Interest |
|
Average |
|||||||
|
Interest-earning assets |
|
|
|
|
|
|
|
|
|
|
|
|
|||||||
|
Cash and cash equivalents |
$ |
30,483 |
|
$ |
328 |
|
4.31 |
% |
|
|
$ |
33,791 |
|
$ |
454 |
|
5.31 |
% |
|
|
Cash and investments segregated |
|
38,611 |
|
|
412 |
|
4.27 |
% |
|
|
|
29,297 |
|
|
388 |
|
5.24 |
% |
|
|
Receivables from brokerage clients |
|
83,137 |
|
|
1,382 |
|
6.65 |
% |
|
|
|
63,804 |
|
|
1,260 |
|
7.81 |
% |
|
|
Available for sale securities (1) |
|
84,590 |
|
|
433 |
|
2.05 |
% |
|
|
|
111,867 |
|
|
594 |
|
2.12 |
% |
|
|
Held to maturity securities (1) |
|
144,401 |
|
|
622 |
|
1.72 |
% |
|
|
|
157,410 |
|
|
690 |
|
1.75 |
% |
|
|
Bank loans |
|
46,043 |
|
|
493 |
|
4.32 |
% |
|
|
|
40,529 |
|
|
440 |
|
4.36 |
% |
|
|
Total interest-earning assets |
|
427,265 |
|
|
3,670 |
|
3.44 |
% |
|
|
|
436,698 |
|
|
3,826 |
|
3.48 |
% |
|
|
Securities lending revenue |
|
|
|
60 |
|
|
|
|
|
|
|
76 |
|
|
|||||
|
Other interest revenue |
|
|
|
27 |
|
|
|
|
|
|
|
39 |
|
|
|||||
|
Total interest-earning assets |
$ |
427,265 |
|
$ |
3,757 |
|
3.52 |
% |
|
|
$ |
436,698 |
|
$ |
3,941 |
|
3.59 |
% |
|
|
Funding sources |
|
|
|
|
|
|
|
|
|
|
|
|
|||||||
|
Bank deposits |
$ |
245,719 |
|
$ |
436 |
|
0.72 |
% |
|
|
$ |
274,368 |
|
$ |
921 |
|
1.35 |
% |
|
|
Payables to brokers, dealers, and clearing organizations (2) |
|
14,177 |
|
|
137 |
|
3.88 |
% |
|
|
|
5,513 |
|
|
55 |
|
3.96 |
% |
|
|
Payables to brokerage clients |
|
90,173 |
|
|
51 |
|
0.23 |
% |
|
|
|
68,343 |
|
|
73 |
|
0.43 |
% |
|
|
Other short-term borrowings |
|
6,695 |
|
|
82 |
|
4.96 |
% |
|
|
|
7,385 |
|
|
103 |
|
5.61 |
% |
|
|
Federal Home Loan Bank borrowings |
|
10,725 |
|
|
133 |
|
4.94 |
% |
|
|
|
24,857 |
|
|
330 |
|
5.27 |
% |
|
|
Long-term debt |
|
22,281 |
|
|
212 |
|
3.81 |
% |
|
|
|
25,000 |
|
|
224 |
|
3.59 |
% |
|
|
Total interest-bearing liabilities (2) |
|
389,770 |
|
|
1,051 |
|
1.09 |
% |
|
|
|
405,466 |
|
|
1,706 |
|
1.69 |
% |
|
|
Non-interest-bearing funding sources (2) |
|
37,495 |
|
|
|
|
|
|
|
31,232 |
|
|
|
|
|||||
|
Other interest expense |
|
|
|
— |
|
|
|
|
|
|
|
2 |
|
|
|||||
|
Total funding sources |
$ |
427,265 |
|
$ |
1,051 |
|
0.99 |
% |
|
|
$ |
436,698 |
|
$ |
1,708 |
|
1.57 |
% |
|
|
Net interest revenue |
|
|
$ |
2,706 |
|
2.53 |
% |
|
|
|
|
$ |
2,233 |
|
2.02 |
% |
|||
|
(1) |
Amounts have been calculated based on amortized cost. |
|
|
(2) |
Beginning in the fourth quarter of 2024, payables to brokers, dealers, and clearing organizations is presented separately from non-interest-bearing funding sources and included in total interest-bearing liabilities. This line item includes securities loaned and related interest expense. Prior period amounts have been reclassified to reflect this change. |
|
|
THE CHARLES SCHWAB CORPORATION |
|||||||||||||||||||
|
Asset Management and Administration Fees Information |
|||||||||||||||||||
|
(In millions, except ratios or as noted) |
|||||||||||||||||||
|
(Unaudited) |
|||||||||||||||||||
|
|
Three Months Ended |
||||||||||||||||||
|
|
2025 |
|
|
2024 |
|||||||||||||||
|
|
Average |
|
Revenue |
|
Average |
|
|
Average |
|
Revenue |
|
Average |
|||||||
|
Schwab money market funds |
$ |
621,474 |
|
$ |
418 |
|
0.27 |
% |
|
|
$ |
499,887 |
|
$ |
336 |
|
0.27 |
% |
|
|
Schwab equity and bond funds, exchange-traded funds (ETFs), and collective trust funds (CTFs) |
|
658,588 |
|
|
122 |
|
0.08 |
% |
|
|
|
539,661 |
|
|
107 |
|
0.08 |
% |
|
|
Mutual Fund OneSource® and other no-transaction-fee funds |
|
359,696 |
|
|
222 |
|
0.25 |
% |
|
|
|
314,576 |
|
|
209 |
|
0.27 |
% |
|
|
Other third-party mutual funds and ETFs |
|
623,647 |
|
|
103 |
|
0.07 |
% |
|
|
|
605,625 |
|
|
106 |
|
0.07 |
% |
|
|
Total mutual funds, ETFs, and CTFs (1) |
$ |
2,263,405 |
|
$ |
865 |
|
0.15 |
% |
|
|
$ |
1,959,749 |
|
$ |
758 |
|
0.16 |
% |
|
|
Managed investing solutions (1) |
|
|
|
|
|
|
|
|
|
|
|
|
|||||||
|
Fee-based |
$ |
590,483 |
|
$ |
569 |
|
0.39 |
% |
|
|
$ |
506,133 |
|
$ |
503 |
|
0.40 |
% |
|
|
Non-fee-based |
|
120,442 |
|
|
— |
|
— |
|
|
|
|
106,032 |
|
|
— |
|
— |
|
|
|
Total managed investing solutions |
$ |
710,925 |
|
$ |
569 |
|
0.32 |
% |
|
|
$ |
612,165 |
|
$ |
503 |
|
0.33 |
% |
|
|
Other balance-based fees (2) |
|
841,555 |
|
|
77 |
|
0.04 |
% |
|
|
|
719,447 |
|
|
69 |
|
0.04 |
% |
|
|
Other (3) |
|
|
|
19 |
|
|
|
|
|
|
|
18 |
|
|
|||||
|
Total asset management and administration fees |
|
|
$ |
1,530 |
|
|
|
|
|
|
$ |
1,348 |
|
|
|||||
|
(1) |
Managed investing solutions includes managed portfolios, specialized strategies, and customized investment advice such as Schwab Wealth AdvisoryTM, Schwab Managed PortfoliosTM, Managed Account Select®, Schwab Advisor Network®, Windhaven Strategies®, ThomasPartners® Strategies, Wasmer SchroederTM Strategies, Schwab Index Advantage advised retirement plan balances, Schwab Intelligent Portfolios®, Institutional Intelligent Portfolios®, Schwab Intelligent Portfolios Premium®, AdvisorDirect®, Essential Portfolios, Selective Portfolios, and Personalized Portfolios; as well as legacy non-fee managed investing solutions including Schwab Advisor Source and certain retirement plan balances. Average client assets for managed investing solutions may also include the asset balances contained in the mutual fund and/or ETF categories listed above. For the total end of period view, please see the Monthly Activity Report. |
|
|
(2) |
Includes various asset-related fees, such as trust fees, 401(k) recordkeeping fees, and mutual fund clearing fees and other service fees. |
|
|
(3) |
Includes miscellaneous service and transaction fees relating to mutual funds and ETFs that are not balance-based. |
|
|
THE CHARLES SCHWAB CORPORATION |
|||||||||||||||||||||||||||
|
Growth in Client Assets and Accounts |
|||||||||||||||||||||||||||
|
(Unaudited) |
|||||||||||||||||||||||||||
|
|
Q1-25 % Change |
|
2025 |
|
2024 |
||||||||||||||||||||||
|
|
vs. |
|
vs. |
|
|
First |
|
Fourth |
|
Third |
|
Second |
|
First |
|||||||||||||
|
(In billions, at quarter end, except as noted) |
Q1-24 |
|
Q4-24 |
|
|
Quarter |
|
Quarter |
|
Quarter |
|
Quarter |
|
Quarter |
|||||||||||||
|
Assets in client accounts |
|
|
|
|
|
|
|
|
|
|
|
|
|
|
|||||||||||||
|
Schwab One®, certain cash equivalents, and bank deposits |
(1 |
)% |
|
(4 |
)% |
|
|
$ |
345.2 |
|
|
$ |
358.8 |
|
|
$ |
334.1 |
|
|
$ |
330.7 |
|
|
$ |
348.2 |
|
|
|
Bank deposit account balances |
(7 |
)% |
|
(4 |
)% |
|
|
|
83.7 |
|
|
|
87.5 |
|
|
|
84.0 |
|
|
|
84.5 |
|
|
|
90.2 |
|
|
|
Proprietary mutual funds (Schwab Funds® and Laudus Funds®) and CTFs |
|
|
|
|
|
|
|
|
|
|
|
|
|
|
|||||||||||||
|
Money market funds (1) |
24 |
% |
|
8 |
% |
|
|
|
641.5 |
|
|
|
596.5 |
|
|
|
562.1 |
|
|
|
533.6 |
|
|
|
515.7 |
|
|
|
Equity and bond funds and CTFs (2) |
10 |
% |
|
(2 |
)% |
|
|
|
227.0 |
|
|
|
232.2 |
|
|
|
228.9 |
|
|
|
214.4 |
|
|
|
206.0 |
|
|
|
Total proprietary mutual funds and CTFs |
20 |
% |
|
5 |
% |
|
|
|
868.5 |
|
|
|
828.7 |
|
|
|
791.0 |
|
|
|
748.0 |
|
|
|
721.7 |
|
|
|
Mutual Fund Marketplace® (3) |
|
|
|
|
|
|
|
|
|
|
|
|
|
|
|||||||||||||
|
Mutual Fund OneSource® and other no-transaction-fee funds |
3 |
% |
|
(2 |
)% |
|
|
|
340.3 |
|
|
|
347.8 |
|
|
|
358.0 |
|
|
|
344.8 |
|
|
|
329.2 |
|
|
|
Mutual fund clearing services |
13 |
% |
|
— |
|
|
|
|
280.6 |
|
|
|
280.7 |
|
|
|
280.8 |
|
|
|
264.7 |
|
|
|
248.1 |
|
|
|
Other third-party mutual funds |
1 |
% |
|
(1 |
)% |
|
|
|
1,195.4 |
|
|
|
1,211.1 |
|
|
|
1,236.5 |
|
|
|
1,177.5 |
|
|
|
1,182.9 |
|
|
|
Total Mutual Fund Marketplace |
3 |
% |
|
(1 |
)% |
|
|
|
1,816.3 |
|
|
|
1,839.6 |
|
|
|
1,875.3 |
|
|
|
1,787.0 |
|
|
|
1,760.2 |
|
|
|
Total mutual fund assets |
8 |
% |
|
1 |
% |
|
|
|
2,684.8 |
|
|
|
2,668.3 |
|
|
|
2,666.3 |
|
|
|
2,535.0 |
|
|
|
2,481.9 |
|
|
|
Exchange-traded funds |
|
|
|
|
|
|
|
|
|
|
|
|
|
|
|||||||||||||
|
Proprietary ETFs (2) |
16 |
% |
|
1 |
% |
|
|
|
398.2 |
|
|
|
395.0 |
|
|
|
385.9 |
|
|
|
349.6 |
|
|
|
342.9 |
|
|
|
Other third-party ETFs |
17 |
% |
|
1 |
% |
|
|
|
1,960.1 |
|
|
|
1,940.6 |
|
|
|
1,888.2 |
|
|
|
1,738.6 |
|
|
|
1,676.6 |
|
|
|
Total ETF assets |
17 |
% |
|
1 |
% |
|
|
|
2,358.3 |
|
|
|
2,335.6 |
|
|
|
2,274.1 |
|
|
|
2,088.2 |
|
|
|
2,019.5 |
|
|
|
Equity and other securities |
9 |
% |
|
(5 |
)% |
|
|
|
3,765.5 |
|
|
|
3,972.6 |
|
|
|
3,839.6 |
|
|
|
3,648.8 |
|
|
|
3,467.7 |
|
|
|
Fixed income securities |
— |
|
|
2 |
% |
|
|
|
775.8 |
|
|
|
762.3 |
|
|
|
795.4 |
|
|
|
792.0 |
|
|
|
779.0 |
|
|
|
Margin loans outstanding |
23 |
% |
|
— |
|
|
|
|
(83.6 |
) |
|
|
(83.8 |
) |
|
|
(73.0 |
) |
|
|
(71.7 |
) |
|
|
(68.1 |
) |
|
|
Total client assets |
9 |
% |
|
(2 |
)% |
|
|
$ |
9,929.7 |
|
|
$ |
10,101.3 |
|
|
$ |
9,920.5 |
|
|
$ |
9,407.5 |
|
|
$ |
9,118.4 |
|
|
|
Client assets by business (4) |
|
|
|
|
|
|
|
|
|
|
|
|
|
|
|||||||||||||
|
Investor Services (5) |
9 |
% |
|
(3 |
)% |
|
|
$ |
5,557.4 |
|
|
$ |
5,721.6 |
|
|
$ |
5,576.7 |
|
|
$ |
5,317.5 |
|
|
$ |
5,108.9 |
|
|
|
Advisor Services (6) |
9 |
% |
|
— |
|
|
|
|
4,372.3 |
|
|
|
4,379.7 |
|
|
|
4,343.8 |
|
|
|
4,090.0 |
|
|
|
4,009.5 |
|
|
|
Total client assets |
9 |
% |
|
(2 |
)% |
|
|
$ |
9,929.7 |
|
|
$ |
10,101.3 |
|
|
$ |
9,920.5 |
|
|
$ |
9,407.5 |
|
|
$ |
9,118.4 |
|
|
|
Net growth in assets in client accounts (for the quarter ended) |
|
|
|
|
|
|
|
|
|
|
|
|
|
|
|||||||||||||
|
Net new assets by business (4) |
|
|
|
|
|
|
|
|
|
|
|
|
|
|
|||||||||||||
|
Investor Services (5) |
85 |
% |
|
50 |
% |
|
|
$ |
69.5 |
|
|
$ |
46.2 |
|
|
$ |
37.2 |
|
|
$ |
40.1 |
|
|
$ |
37.6 |
|
|
|
Advisor Services (6) |
24 |
% |
|
1 |
% |
|
|
|
62.9 |
|
|
|
62.2 |
|
|
|
53.6 |
|
|
|
34.1 |
|
|
|
50.6 |
|
|
|
Total net new assets |
50 |
% |
|
22 |
% |
|
|
$ |
132.4 |
|
|
$ |
108.4 |
|
|
$ |
90.8 |
|
|
$ |
74.2 |
|
|
$ |
88.2 |
|
|
|
Net market gains (losses) |
|
|
|
|
|
|
(304.0 |
) |
|
|
72.4 |
|
|
|
422.2 |
|
|
|
214.9 |
|
|
|
513.6 |
|
|||
|
Net growth (decline) |
|
|
|
|
|
$ |
(171.6 |
) |
|
$ |
180.8 |
|
|
$ |
513.0 |
|
|
$ |
289.1 |
|
|
$ |
601.8 |
|
|||
|
New brokerage accounts (in thousands, for the quarter ended) |
8 |
% |
|
6 |
% |
|
|
|
1,183 |
|
|
|
1,119 |
|
|
|
972 |
|
|
|
985 |
|
|
|
1,094 |
|
|
|
Client accounts (in thousands) |
|
|
|
|
|
|
|
|
|
|
|
|
|
|
|||||||||||||
|
Active brokerage accounts |
5 |
% |
|
2 |
% |
|
|
|
37,011 |
|
|
|
36,456 |
|
|
|
35,982 |
|
|
|
35,612 |
|
|
|
35,301 |
|
|
|
Banking accounts |
9 |
% |
|
3 |
% |
|
|
|
2,050 |
|
|
|
1,998 |
|
|
|
1,954 |
|
|
|
1,931 |
|
|
|
1,885 |
|
|
|
Workplace Plan Participant Accounts (7) |
4 |
% |
|
2 |
% |
|
|
|
5,495 |
|
|
|
5,399 |
|
|
|
5,388 |
|
|
|
5,363 |
|
|
|
5,277 |
|
|
|
|
|
|
|
|
|
|
|
|
|
|
|
|
|
|
|||||||||||||
|
(1) |
Total client assets in purchased money market funds are located at: https://www.aboutschwab.com/investor-relations. |
|
|
(2) |
Includes balances held on and off the Schwab platform. As of March 31, 2025, off-platform equity and bond funds, CTFs, and ETFs were $34.5 billion, $3.9 billion, and $144.8 billion, respectively. |
|
|
(3) |
Excludes all proprietary mutual funds and ETFs. |
|
|
(4) |
In the fourth quarter of 2024, Retirement Business Services moved from Advisor Services to Investor Services. Prior periods have been recast. |
|
|
(5) |
First quarter of 2025 includes net outflows of $5.3 billion from off-platform Schwab Bank Retail CDs. Fourth quarter of 2024 includes net outflows of $5.5 billion from off-platform Schwab Bank Retail CDs and an outflow of $0.6 billion from a large international relationship. Third quarter of 2024 includes net outflows of $4.4 billion from off-platform Schwab Bank Retail CDs and an outflow of $0.1 billion from a large international relationship. Second quarter of 2024 includes net inflows of $2.7 billion from off-platform Schwab Bank Retail CDs and an inflow of $10.3 billion from a mutual fund clearing services client. First quarter of 2024 includes net outflows of $7.4 billion from off-platform Schwab Bank Retail CDs. |
|
|
(6) |
Fourth quarter of 2024 includes an outflow of $0.3 billion from a large international relationship. |
|
|
(7) |
Includes Retirement Plan Services, Stock Plan Services, Designated Brokerage Services, and Retirement Business Services. Participants may be enrolled in services in more than one Workplace business. |
|
Contacts
MEDIA
Mayura Hooper, 415-667-1525
[email protected]
INVESTORS/ANALYSTS
Jeff Edwards, 817-854-6177
[email protected]