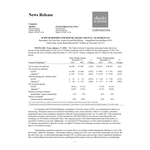
December Core Net New Assets Exceed $40 Billion – Annualized Growth Rate of 6%
Total Client Assets Reach Record $8.5 Trillion at Year-end, Up 21%
WESTLAKE, Texas–(BUSINESS WIRE)–The Charles Schwab Corporation announced today that its net income for the fourth quarter of 2023 was $1.0 billion compared with $2.0 billion for the fourth quarter of 2022. Net income for the twelve months ended December 31, 2023 was $5.1 billion, compared with $7.2 billion for the year-earlier period.


|
|
Three Months Ended December 31, |
|
% |
|
Twelve Months Ended December 31, |
|
% |
||||||||||||||
|
Financial Highlights (1) |
|
2023 |
|
|
|
2022 |
|
|
Change |
|
|
2023 |
|
|
|
2022 |
|
|
Change |
||
|
|
|
|
|
|
|
|
|
|
|
|
|
||||||||||
|
Net revenues (in millions) |
$ |
4,459 |
|
|
$ |
5,497 |
|
|
(19)% |
|
$ |
18,837 |
|
|
$ |
20,762 |
|
|
(9)% |
||
|
Net income (in millions) |
|
|
|
|
|
|
|
|
|
|
|
||||||||||
|
GAAP |
$ |
1,045 |
|
|
$ |
1,968 |
|
|
(47)% |
|
$ |
5,067 |
|
|
$ |
7,183 |
|
|
(29)% |
||
|
Adjusted (1) |
$ |
1,367 |
|
|
$ |
2,151 |
|
|
(36)% |
|
$ |
6,159 |
|
|
$ |
7,934 |
|
|
(22)% |
||
|
Diluted earnings per common share |
|
|
|
|
|
|
|
|
|
|
|
||||||||||
|
GAAP |
$ |
.51 |
|
|
$ |
.97 |
|
|
(47)% |
|
$ |
2.54 |
|
|
$ |
3.50 |
|
|
(27)% |
||
|
Adjusted (1) |
$ |
.68 |
|
|
$ |
1.07 |
|
|
(36)% |
|
$ |
3.13 |
|
|
$ |
3.90 |
|
|
(20)% |
||
|
Pre-tax profit margin |
|
|
|
|
|
|
|
|
|
|
|
||||||||||
|
GAAP |
|
26.8 |
% |
|
|
47.3 |
% |
|
|
|
|
33.9 |
% |
|
|
45.2 |
% |
|
|
||
|
Adjusted (1) |
|
36.0 |
% |
|
|
51.6 |
% |
|
|
|
|
41.5 |
% |
|
|
50.0 |
% |
|
|
||
|
Return on average common stockholders’ equity (annualized) |
|
12 |
% |
|
|
27 |
% |
|
|
|
|
16 |
% |
|
|
18 |
% |
|
|
||
|
Return on tangible common equity (annualized) (1) |
|
43 |
% |
|
|
102 |
% |
|
|
|
|
54 |
% |
|
|
42 |
% |
|
|
||
|
Note: All per-share results are rounded to the nearest cent, based on weighted-average diluted common shares outstanding. |
||
|
(1) |
|
Further details on non-GAAP financial measures and a reconciliation of such measures to GAAP reported results are included on pages 10-12 of this release. |
Co-Chairman and CEO Walt Bettinger commented, “Over the course of 2023, our commitment to clients was unwavering. Through an uneven environment with shifting views on the trajectory of the U.S. economy, persistent geopolitical unrest, and a temporary disruption within the regional banking sector, our “no trade-offs” value proposition continued to resonate with investors. Clients entrusted us with $306 billion in core net new assets during the year, including over $43 billion in December alone. This ongoing success with clients helped push total client assets to a record $8.52 trillion at year-end. Additionally, we welcomed 977 thousand new-to-firm retail households as well as 315 advisors-in-transition to Schwab. In total, we added 3.8 million new brokerage accounts to increase our total client base to 34.8 million accounts.”
“Maintaining sustained investment in our clients allows our modern wealth management offering to evolve with their needs,” added Mr. Bettinger. “The primary objective coming into 2023 was a successful Ameritrade conversion. By the end of the year, we had transitioned approximately 90% of client assets and accounts with no significant disruptions. The overall feedback from both retail investors and Registered Investment Advisors (RIAs) has been overwhelmingly positive – and when there were minor issues, we addressed most concerns immediately. The entire leadership team is grateful for the tireless efforts of our employees, whose diligent planning has put us in a position to complete the largest integration in our industry’s history, with deal-related attrition tracking better than our initial expectations.”
“While the Ameritrade client conversion garnered a lot of attention and significant resources, we also made substantial progress across our key strategic initiatives of scale and efficiency, win-win monetization, and client segmentation. We took steps to unlock incremental efficiency, including identifying at least $500 million in cost savings beyond the pre-committed Ameritrade synergies. As part of this effort, we reduced our workforce by approximately 6% of staff, which helped streamline the organization and enables us to prioritize investments in key client initiatives. Enhancements to our personalized investing and wealth management solutions demonstrated progress on our win-win monetization efforts. Net flows into our managed investing solutions totaled $33 billion, a 29% increase versus the previous year, supported by record flows into Schwab Wealth Advisory™ and Wasmer Schroeder™ Strategies. We also saw building momentum within Schwab Personalized Indexing® and launched Schwab Investing Themes™. We improved digital capabilities for RIAs, including a new account onboarding workflow and an expedited origination process for our Pledged Asset Line® product. Finally, recognizing that certain client segments often have different needs, we announced new curated experiences for our high net worth and trader clients. Creating more tailored experiences for these individuals helps ensure they are getting the most from their relationship with Schwab.”
Mr. Bettinger finished, “As we move forward with our key initiatives, we remain as confident as ever in our “Through Clients’ Eyes” strategy. Our client focus has guided our culture and operating priorities for five decades and we believe it keeps us best positioned to sustain long-term profitable growth into the future.”
CFO Peter Crawford stated, “Schwab’s financial performance during 2023 reflected the challenges of navigating a market environment shaped by the Federal Reserve’s pronounced interest rate tightening policy and the follow-on effects stemming from the regional banking crisis in March. Total net revenues were down 9% versus prior year levels to $18.8 billion, as client cash realignment activity impacted our net interest revenue. The benefits of rising rates were more than offset by lower interest-earning assets and increased utilization of higher-cost supplemental funding, driving net interest revenue down 12% year-over-year to $9.4 billion. Asset management and administration fees rose to a record $4.8 billion, bolstered by rebounding equity markets as well as strong client interest in purchased money fund products and advisory solutions. A slightly different trading mix and softer volumes led trading revenue to decline 12% to $3.2 billion. On the expense front, GAAP spending grew by 10% to $12.5 billion to facilitate the Ameritrade integration, make investments across our strategic initiatives, and capture incremental cost savings of approximately $500 million that will be realized in 2024. Restructuring costs required to effect these savings totaled $495 million, while acquisition and integration-related costs and amortization of acquired intangibles were $401 million and $534 million, respectively. Exclusive of these items, adjusted total expenses (1) increased by 6% to $11.0 billion, approximately 2% of which reflected the $172 million FDIC special assessment. Together, the combination of our diversified revenue model and rigorous expense discipline enabled us to generate a 33.9% pre-tax profit margin for the full-year, or 41.5% on an adjusted basis (1). These results represent the 11th consecutive year of GAAP pre-tax margins exceeding 30% and the
5th consecutive year of an adjusted pre-tax margin above 40%.”
“Throughout 2023, our approach to balance sheet management continued to prioritize flexibility,” Mr. Crawford added. “We opportunistically raised $6.2 billion in senior notes to prepare for upcoming maturities as well as provide additional liquidity during the larger Ameritrade conversion weekends. While the pace of rate increases slowed substantially during the year, the upper bound of the Fed Funds target range still climbed to 5.50%. As expected, clients took advantage of the highest yields in nearly two decades by increasing their allocations to investment cash and fixed income alternatives available at Schwab. These movements caused Schwab’s balance sheet to shrink by $59 billion, or an 11% decline from the year-end 2022 level. As we have done since the onset of the current tightening cycle, we facilitated these client allocation decisions using cash flows from our investment portfolios as well as the continued utilization of certain supplemental funding sources, including Federal Home Loan Bank advances and retail certificates of deposit. We began to reduce our reliance on these additional sources – repaying 18% of peak balances reached in May 2023 – as realignment activity decelerated by almost 80% during the second half of the year, including a seasonal increase in client cash in December. Earlier in the year, we made the decision to temporarily suspend our stock buyback program after repurchasing 37 million shares for $2.8 billion during the first quarter of the year. This action allows us to more rapidly build our capital ratios inclusive of accumulated other comprehensive income via our healthy earnings power and lower capital intensity. The company’s preliminary consolidated Tier 1 Leverage and Adjusted Tier 1 Leverage (1) ratios increased to 8.5% and 4.9%, respectively. Ratios for Charles Schwab Bank, SSB (CSB) grew as well, with CSB’s preliminary Tier 1 Leverage finishing the year at 10.1%, or 5.4% on an adjusted basis (1).”
Mr. Crawford concluded, “While 2023 presented a number of challenges, we stayed focused on meeting the evolving needs of our clients. Guided by our client-centric approach, we move ahead with confidence that our “through the cycle” financial formula keeps us positioned to deliver long-term stockholder value.”
|
(1) |
|
Further details on non-GAAP financial measures and a reconciliation of such measures to GAAP reported results are included on pages 10-12 of this release. |
Commentary from the CFO
Periodically, our Chief Financial Officer provides insight and commentary regarding Schwab’s financial picture at: https://www.aboutschwab.com/cfo-commentary. The most recent commentary, which provides perspective on client cash realignment trends and second quarter revenue expectations, was posted on June 14, 2023.
Winter Business Update
The company will host its Winter Business Update for institutional investors this morning from 7:30 a.m. – 8:30 a.m. CT, 8:30 a.m. – 9:30 a.m. ET.
Registration for this Update webcast is accessible at https://www.aboutschwab.com/schwabevents.
Forward-Looking Statements
This press release contains forward-looking statements relating to the company’s strategy and approach; Ameritrade integration and deal-related attrition; opportunities for increased efficiency and resulting incremental annual expense savings; investment in client initiatives; profitable growth; positioning; business model; financial formula; stock repurchases; capital ratios; earnings power; balance sheet; and stockholder value. These forward-looking statements reflect management’s expectations as of the date hereof. Achievement of these expectations and objectives is subject to risks and uncertainties that could cause actual results to differ materially from the expressed expectations.
Important factors that may cause such differences include, but are not limited to, the company’s ability to attract and retain clients and independent investment advisors and grow those relationships and client assets; develop and launch new and enhanced products, services, and capabilities, as well as enhance its infrastructure and capacity, in a timely and successful manner; hire and retain talent; support client activity levels; successfully implement integration strategies and plans; capture Ameritrade deal expense synergies, streamline its operational design, align its real estate footprint, and harness the benefits of automation in order to deliver expected incremental annual expense savings, and the costs incurred in connection with such actions; manage expenses; and monetize client assets. Other important factors include client use of the company’s advisory solutions and other products and services; general market conditions, including the level of interest rates and equity valuations; higher than expected asset attrition from clients originating at Ameritrade; client cash allocation decisions; client sensitivity to rates; level of client assets, including cash balances; competitive pressures on pricing; the level and mix of client trading activity; market volatility; capital and liquidity needs and management; balance sheet positioning relative to changes in interest rates; interest earning asset mix and growth; new or changed legislation, regulation or regulatory expectations; and other factors set forth in the company’s most recent reports on Form 10-K and Form 10-Q.
About Charles Schwab
The Charles Schwab Corporation (NYSE: SCHW) is a leading provider of financial services, with 34.8 million active brokerage accounts, 5.2 million workplace plan participant accounts, 1.8 million banking accounts, and $8.52 trillion in client assets. Through its operating subsidiaries, the company provides a full range of wealth management, securities brokerage, banking, asset management, custody, and financial advisory services to individual investors and independent investment advisors. Its broker-dealer subsidiaries, Charles Schwab & Co., Inc., TD Ameritrade, Inc., and TD Ameritrade Clearing, Inc., (members SIPC, https://www.sipc.org), and their affiliates offer a complete range of investment services and products including an extensive selection of mutual funds; financial planning and investment advice; retirement plan and equity compensation plan services; referrals to independent, fee-based investment advisors; and custodial, operational and trading support for independent, fee-based investment advisors through Schwab Advisor Services. Its primary banking subsidiary, Charles Schwab Bank, SSB (member FDIC and an Equal Housing Lender), provides banking and lending services and products. More information is available at https://www.aboutschwab.com. TD Ameritrade, Inc. and TD Ameritrade Clearing, Inc. are separate but affiliated companies and subsidiaries of TD Ameritrade Holding LLC. TD Ameritrade Holding LLC is a wholly owned subsidiary of The Charles Schwab Corporation. TD Ameritrade is a trademark jointly owned by TD Ameritrade IP Company, Inc. and The Toronto-Dominion Bank.
|
THE CHARLES SCHWAB CORPORATION Consolidated Statements of Income (In millions, except per share amounts) (Unaudited) |
|||||||||||||||
|
|
Three Months Ended December 31, |
|
Twelve Months Ended December 31, |
||||||||||||
|
|
|
2023 |
|
|
|
2022 |
|
|
|
2023 |
|
|
|
2022 |
|
|
Net Revenues |
|
|
|
|
|
|
|
||||||||
|
Interest revenue |
$ |
3,963 |
|
|
$ |
3,841 |
|
|
$ |
16,111 |
|
|
$ |
12,227 |
|
|
Interest expense |
|
(1,833 |
) |
|
|
(812 |
) |
|
|
(6,684 |
) |
|
|
(1,545 |
) |
|
Net interest revenue |
|
2,130 |
|
|
|
3,029 |
|
|
|
9,427 |
|
|
|
10,682 |
|
|
Asset management and administration fees (1) |
|
1,241 |
|
|
|
1,049 |
|
|
|
4,756 |
|
|
|
4,216 |
|
|
Trading revenue |
|
767 |
|
|
|
895 |
|
|
|
3,230 |
|
|
|
3,673 |
|
|
Bank deposit account fees |
|
174 |
|
|
|
350 |
|
|
|
705 |
|
|
|
1,409 |
|
|
Other |
|
147 |
|
|
|
174 |
|
|
|
719 |
|
|
|
782 |
|
|
Total net revenues |
|
4,459 |
|
|
|
5,497 |
|
|
|
18,837 |
|
|
|
20,762 |
|
|
Expenses Excluding Interest |
|
|
|
|
|
|
|
||||||||
|
Compensation and benefits |
|
1,409 |
|
|
|
1,488 |
|
|
|
6,315 |
|
|
|
5,936 |
|
|
Professional services |
|
253 |
|
|
|
266 |
|
|
|
1,058 |
|
|
|
1,032 |
|
|
Occupancy and equipment |
|
331 |
|
|
|
320 |
|
|
|
1,254 |
|
|
|
1,175 |
|
|
Advertising and market development |
|
104 |
|
|
|
123 |
|
|
|
397 |
|
|
|
419 |
|
|
Communications |
|
144 |
|
|
|
144 |
|
|
|
629 |
|
|
|
588 |
|
|
Depreciation and amortization |
|
238 |
|
|
|
176 |
|
|
|
804 |
|
|
|
652 |
|
|
Amortization of acquired intangible assets |
|
130 |
|
|
|
136 |
|
|
|
534 |
|
|
|
596 |
|
|
Regulatory fees and assessments |
|
270 |
|
|
|
62 |
|
|
|
547 |
|
|
|
262 |
|
|
Other |
|
386 |
|
|
|
184 |
|
|
|
921 |
|
|
|
714 |
|
|
Total expenses excluding interest |
|
3,265 |
|
|
|
2,899 |
|
|
|
12,459 |
|
|
|
11,374 |
|
|
Income before taxes on income |
|
1,194 |
|
|
|
2,598 |
|
|
|
6,378 |
|
|
|
9,388 |
|
|
Taxes on income |
|
149 |
|
|
|
630 |
|
|
|
1,311 |
|
|
|
2,205 |
|
|
Net Income |
|
1,045 |
|
|
|
1,968 |
|
|
|
5,067 |
|
|
|
7,183 |
|
|
Preferred stock dividends and other |
|
119 |
|
|
|
147 |
|
|
|
418 |
|
|
|
548 |
|
|
Net Income Available to Common Stockholders |
$ |
926 |
|
|
$ |
1,821 |
|
|
$ |
4,649 |
|
|
$ |
6,635 |
|
|
Weighted-Average Common Shares Outstanding: |
|
|
|
|
|
|
|
||||||||
|
Basic |
|
1,823 |
|
|
|
1,864 |
|
|
|
1,824 |
|
|
|
1,885 |
|
|
Diluted |
|
1,828 |
|
|
|
1,873 |
|
|
|
1,831 |
|
|
|
1,894 |
|
|
Earnings Per Common Shares Outstanding (2): |
|
|
|
|
|
|
|
||||||||
|
Basic |
$ |
.51 |
|
|
$ |
.98 |
|
|
$ |
2.55 |
|
|
$ |
3.52 |
|
|
Diluted |
$ |
.51 |
|
|
$ |
.97 |
|
|
$ |
2.54 |
|
|
$ |
3.50 |
|
|
(1) |
|
No fee waivers were recognized for the three and twelve months ended December 31, 2023, or for the three months ended December 31, 2022. Includes fee waivers of $57 million for the twelve months ended December 31, 2022. |
|
(2) |
|
The Company has voting and nonvoting common stock outstanding. As the participation rights, including dividend and liquidation rights, are identical between the voting and nonvoting stock classes, basic and diluted earnings per share are the same for each class. |
|
THE CHARLES SCHWAB CORPORATION Financial and Operating Highlights (Unaudited) |
||||||||||||||||||||||||||
|
|
Q4-23 % change |
|
|
2023 |
|
|
2022 |
|
||||||||||||||||||
|
|
vs. |
|
vs. |
|
|
Fourth |
|
Third |
|
Second |
|
First |
|
Fourth |
||||||||||||
|
(In millions, except per share amounts and as noted) |
Q4-22 |
|
Q3-23 |
|
|
Quarter |
|
Quarter |
|
Quarter |
|
Quarter |
|
Quarter |
||||||||||||
|
Net Revenues |
|
|
|
|
|
|
|
|
|
|
|
|
|
|
||||||||||||
|
Net interest revenue |
(30 |
)% |
|
(5 |
)% |
|
|
$ |
2,130 |
|
|
$ |
2,237 |
|
|
$ |
2,290 |
|
|
$ |
2,770 |
|
|
$ |
3,029 |
|
|
Asset management and administration fees |
18 |
% |
|
1 |
% |
|
|
|
1,241 |
|
|
|
1,224 |
|
|
|
1,173 |
|
|
|
1,118 |
|
|
|
1,049 |
|
|
Trading revenue |
(14 |
)% |
|
— |
|
|
|
|
767 |
|
|
|
768 |
|
|
|
803 |
|
|
|
892 |
|
|
|
895 |
|
|
Bank deposit account fees |
(50 |
)% |
|
(15 |
)% |
|
|
|
174 |
|
|
|
205 |
|
|
|
175 |
|
|
|
151 |
|
|
|
350 |
|
|
Other |
(16 |
)% |
|
(15 |
)% |
|
|
|
147 |
|
|
|
172 |
|
|
|
215 |
|
|
|
185 |
|
|
|
174 |
|
|
Total net revenues |
(19 |
)% |
|
(3 |
)% |
|
|
|
4,459 |
|
|
|
4,606 |
|
|
|
4,656 |
|
|
|
5,116 |
|
|
|
5,497 |
|
|
Expenses Excluding Interest |
|
|
|
|
|
|
|
|
|
|
|
|
|
|
||||||||||||
|
Compensation and benefits (1) |
(5 |
)% |
|
(20 |
)% |
|
|
|
1,409 |
|
|
|
1,770 |
|
|
|
1,498 |
|
|
|
1,638 |
|
|
|
1,488 |
|
|
Professional services |
(5 |
)% |
|
(8 |
)% |
|
|
|
253 |
|
|
|
275 |
|
|
|
272 |
|
|
|
258 |
|
|
|
266 |
|
|
Occupancy and equipment |
3 |
% |
|
9 |
% |
|
|
|
331 |
|
|
|
305 |
|
|
|
319 |
|
|
|
299 |
|
|
|
320 |
|
|
Advertising and market development |
(15 |
)% |
|
2 |
% |
|
|
|
104 |
|
|
|
102 |
|
|
|
103 |
|
|
|
88 |
|
|
|
123 |
|
|
Communications |
— |
|
|
(5 |
)% |
|
|
|
144 |
|
|
|
151 |
|
|
|
188 |
|
|
|
146 |
|
|
|
144 |
|
|
Depreciation and amortization |
35 |
% |
|
20 |
% |
|
|
|
238 |
|
|
|
198 |
|
|
|
191 |
|
|
|
177 |
|
|
|
176 |
|
|
Amortization of acquired intangible assets |
(4 |
)% |
|
(4 |
)% |
|
|
|
130 |
|
|
|
135 |
|
|
|
134 |
|
|
|
135 |
|
|
|
136 |
|
|
Regulatory fees and assessments |
N/M |
|
|
137 |
% |
|
|
|
270 |
|
|
|
114 |
|
|
|
80 |
|
|
|
83 |
|
|
|
62 |
|
|
Other (2) |
110 |
% |
|
123 |
% |
|
|
|
386 |
|
|
|
173 |
|
|
|
180 |
|
|
|
182 |
|
|
|
184 |
|
|
Total expenses excluding interest |
13 |
% |
|
1 |
% |
|
|
|
3,265 |
|
|
|
3,223 |
|
|
|
2,965 |
|
|
|
3,006 |
|
|
|
2,899 |
|
|
Income before taxes on income |
(54 |
)% |
|
(14 |
)% |
|
|
|
1,194 |
|
|
|
1,383 |
|
|
|
1,691 |
|
|
|
2,110 |
|
|
|
2,598 |
|
|
Taxes on income |
(76 |
)% |
|
(42 |
)% |
|
|
|
149 |
|
|
|
258 |
|
|
|
397 |
|
|
|
507 |
|
|
|
630 |
|
|
Net Income |
(47 |
)% |
|
(7 |
)% |
|
|
|
1,045 |
|
|
|
1,125 |
|
|
|
1,294 |
|
|
|
1,603 |
|
|
|
1,968 |
|
|
Preferred stock dividends and other |
(19 |
)% |
|
10 |
% |
|
|
|
119 |
|
|
|
108 |
|
|
|
121 |
|
|
|
70 |
|
|
|
147 |
|
|
Net Income Available to Common Stockholders |
(49 |
)% |
|
(9 |
)% |
|
|
$ |
926 |
|
|
$ |
1,017 |
|
|
$ |
1,173 |
|
|
$ |
1,533 |
|
|
$ |
1,821 |
|
|
Earnings per common share (3): |
|
|
|
|
|
|
|
|
|
|
|
|
|
|
||||||||||||
|
Basic |
(48 |
)% |
|
(9 |
)% |
|
|
$ |
.51 |
|
|
$ |
.56 |
|
|
$ |
.64 |
|
|
$ |
.84 |
|
|
$ |
.98 |
|
|
Diluted |
(47 |
)% |
|
(9 |
)% |
|
|
$ |
.51 |
|
|
$ |
.56 |
|
|
$ |
.64 |
|
|
$ |
.83 |
|
|
$ |
.97 |
|
|
Dividends declared per common share |
14 |
% |
|
— |
|
|
|
$ |
.25 |
|
|
$ |
.25 |
|
|
$ |
.25 |
|
|
$ |
.25 |
|
|
$ |
.22 |
|
|
Weighted-average common shares outstanding: |
|
|
|
|
|
|
|
|
|
|
|
|
|
|
||||||||||||
|
Basic |
(2 |
)% |
|
— |
|
|
|
|
1,823 |
|
|
|
1,821 |
|
|
|
1,820 |
|
|
|
1,834 |
|
|
|
1,864 |
|
|
Diluted |
(2 |
)% |
|
— |
|
|
|
|
1,828 |
|
|
|
1,827 |
|
|
|
1,825 |
|
|
|
1,842 |
|
|
|
1,873 |
|
|
Performance Measures |
|
|
|
|
|
|
|
|
|
|
|
|
|
|
||||||||||||
|
Pre-tax profit margin |
|
|
|
|
|
|
26.8 |
% |
|
|
30.0 |
% |
|
|
36.3 |
% |
|
|
41.2 |
% |
|
|
47.3 |
% |
||
|
Return on average common stockholders’ equity (annualized) (4) |
|
|
|
|
|
|
12 |
% |
|
|
14 |
% |
|
|
17 |
% |
|
|
23 |
% |
|
|
27 |
% |
||
|
Financial Condition (at quarter end, in billions) |
|
|
|
|
|
|
|
|
|
|
|
|
|
|
||||||||||||
|
Cash and cash equivalents |
8 |
% |
|
30 |
% |
|
|
$ |
43.3 |
|
|
$ |
33.3 |
|
|
$ |
47.7 |
|
|
$ |
49.2 |
|
|
$ |
40.2 |
|
|
Cash and investments segregated |
(26 |
)% |
|
71 |
% |
|
|
|
31.8 |
|
|
|
18.6 |
|
|
|
25.1 |
|
|
|
31.0 |
|
|
|
43.0 |
|
|
Receivables from brokerage clients — net |
3 |
% |
|
(1 |
)% |
|
|
|
68.7 |
|
|
|
69.1 |
|
|
|
65.2 |
|
|
|
63.2 |
|
|
|
66.6 |
|
|
Available for sale securities |
(27 |
)% |
|
(2 |
)% |
|
|
|
107.6 |
|
|
|
110.3 |
|
|
|
125.8 |
|
|
|
141.3 |
|
|
|
147.9 |
|
|
Held to maturity securities |
(8 |
)% |
|
(2 |
)% |
|
|
|
159.5 |
|
|
|
162.5 |
|
|
|
166.3 |
|
|
|
169.9 |
|
|
|
173.1 |
|
|
Bank loans — net |
— |
|
|
— |
|
|
|
|
40.4 |
|
|
|
40.3 |
|
|
|
40.1 |
|
|
|
40.0 |
|
|
|
40.5 |
|
|
Total assets |
(11 |
)% |
|
4 |
% |
|
|
|
493.2 |
|
|
|
475.2 |
|
|
|
511.5 |
|
|
|
535.6 |
|
|
|
551.8 |
|
|
Bank deposits |
(21 |
)% |
|
2 |
% |
|
|
|
290.0 |
|
|
|
284.4 |
|
|
|
304.4 |
|
|
|
325.7 |
|
|
|
366.7 |
|
|
Payables to brokerage clients |
(13 |
)% |
|
16 |
% |
|
|
|
84.8 |
|
|
|
72.8 |
|
|
|
84.8 |
|
|
|
87.6 |
|
|
|
97.4 |
|
|
Other short-term borrowings (5) |
40 |
% |
|
(13 |
)% |
|
|
|
6.6 |
|
|
|
7.6 |
|
|
|
7.8 |
|
|
|
7.1 |
|
|
|
4.7 |
|
|
Federal Home Loan Bank borrowings (5) |
113 |
% |
|
(17 |
)% |
|
|
|
26.4 |
|
|
|
31.8 |
|
|
|
41.0 |
|
|
|
45.6 |
|
|
|
12.4 |
|
|
Long-term debt |
25 |
% |
|
5 |
% |
|
|
|
26.1 |
|
|
|
24.8 |
|
|
|
22.5 |
|
|
|
20.0 |
|
|
|
20.8 |
|
|
Stockholders’ equity |
12 |
% |
|
8 |
% |
|
|
|
41.0 |
|
|
|
37.8 |
|
|
|
37.1 |
|
|
|
36.3 |
|
|
|
36.6 |
|
|
Other |
|
|
|
|
|
|
|
|
|
|
|
|
|
|
||||||||||||
|
Full-time equivalent employees (at quarter end, in thousands) |
(7 |
)% |
|
(8 |
)% |
|
|
|
33.0 |
|
|
|
35.9 |
|
|
|
36.6 |
|
|
|
36.0 |
|
|
|
35.3 |
|
|
Capital expenditures — purchases of equipment, office facilities, and property, net (in millions) |
(6 |
)% |
|
(20 |
)% |
|
|
$ |
199 |
|
|
$ |
250 |
|
|
$ |
168 |
|
|
$ |
187 |
|
|
$ |
211 |
|
|
Expenses excluding interest as a percentage of average client assets (annualized) |
|
|
|
|
|
|
0.16 |
% |
|
|
0.16 |
% |
|
|
0.15 |
% |
|
|
0.17 |
% |
|
|
0.16 |
% |
||
|
Clients’ Daily Average Trades (DATs) (in thousands) |
(4 |
)% |
|
— |
|
|
|
|
5,192 |
|
|
|
5,218 |
|
|
|
5,272 |
|
|
|
5,895 |
|
|
|
5,389 |
|
|
Number of Trading Days |
— |
|
|
— |
|
|
|
|
62.5 |
|
|
|
62.5 |
|
|
|
62.0 |
|
|
|
62.0 |
|
|
|
62.5 |
|
|
Revenue Per Trade (6) |
(11 |
)% |
|
— |
|
|
|
$ |
2.36 |
|
|
$ |
2.35 |
|
|
$ |
2.46 |
|
|
$ |
2.44 |
|
|
$ |
2.66 |
|
|
|
|
|
|
|
|
|
|
|
|
|
|
|
|
|
||||||||||||
|
(1) |
|
Fourth quarter of 2023 includes $16 million in restructuring costs. Third quarter of 2023 includes $276 million in restructuring costs. |
|
(2) |
|
Fourth quarter of 2023 includes $181 million in restructuring costs. |
|
(3) |
|
The Company has voting and nonvoting common stock outstanding. As the participation rights, including dividend and liquidation rights, are identical between the voting and nonvoting stock classes, basic and diluted earnings per share are the same for each class. |
|
(4) |
|
Return on average common stockholders’ equity is calculated using net income available to common stockholders divided by average common stockholders’ equity. |
|
(5) |
|
Beginning in the first quarter of 2023, Federal Home Loan Bank borrowings are presented separately from other short-term borrowings. Prior period amounts have been reclassified to reflect this change. |
|
(6) |
|
Revenue per trade is calculated as trading revenue divided by DATs multiplied by the number of trading days. |
|
N/M Not meaningful. Percentage changes greater than 200% are presented as not meaningful. |
||
|
THE CHARLES SCHWAB CORPORATION Net Interest Revenue Information (In millions, except ratios or as noted) (Unaudited) |
|||||||||||||||||||||||||||||||||||||||
|
|
Three Months Ended December 31, |
|
|
Twelve Months Ended December 31, |
|||||||||||||||||||||||||||||||||||
|
|
2023 |
|
|
2022 |
|
|
2023 |
|
|
2022 |
|||||||||||||||||||||||||||||
|
|
Average Balance |
|
Interest Revenue/ Expense |
|
Average Yield/ Rate |
|
|
Average Balance |
|
Interest Revenue/ Expense |
|
Average Yield/ Rate |
|
|
Average Balance |
|
Interest Revenue/ Expense |
|
Average Yield/ Rate |
|
|
Average Balance |
|
Interest Revenue/ Expense |
|
Average Yield/ Rate |
|||||||||||||
|
Interest-earning assets |
|
|
|
|
|
|
|
|
|
|
|
|
|
|
|
|
|
|
|
|
|
|
|
|
|
|
|||||||||||||
|
Cash and cash equivalents |
$ |
35,312 |
|
$ |
475 |
|
5.27 |
% |
|
|
$ |
38,067 |
|
$ |
351 |
|
3.62 |
% |
|
|
$ |
37,846 |
|
$ |
1,894 |
|
4.94 |
% |
|
|
$ |
57,163 |
|
$ |
812 |
|
|
1.40 |
% |
|
Cash and investments segregated |
|
23,830 |
|
|
314 |
|
5.16 |
% |
|
|
|
45,096 |
|
|
383 |
|
3.33 |
% |
|
|
|
28,259 |
|
|
1,355 |
|
4.73 |
% |
|
|
|
49,430 |
|
|
691 |
|
|
1.38 |
% |
|
Receivables from brokerage clients |
|
62,602 |
|
|
1,260 |
|
7.88 |
% |
|
|
|
66,663 |
|
|
1,077 |
|
6.32 |
% |
|
|
|
61,914 |
|
|
4,793 |
|
7.64 |
% |
|
|
|
75,614 |
|
|
3,321 |
|
|
4.33 |
% |
|
Available for sale securities (1,2) |
|
118,831 |
|
|
647 |
|
2.16 |
% |
|
|
|
196,577 |
|
|
943 |
|
1.90 |
% |
|
|
|
137,178 |
|
|
2,987 |
|
2.17 |
% |
|
|
|
260,392 |
|
|
4,139 |
|
|
1.58 |
% |
|
Held to maturity securities |
|
160,378 |
|
|
700 |
|
1.74 |
% |
|
|
|
146,384 |
|
|
626 |
|
1.70 |
% |
|
|
|
165,634 |
|
|
2,872 |
|
1.73 |
% |
|
|
|
112,357 |
|
|
1,688 |
|
|
1.50 |
% |
|
Bank loans |
|
40,386 |
|
|
437 |
|
4.31 |
% |
|
|
|
40,531 |
|
|
366 |
|
3.59 |
% |
|
|
|
40,234 |
|
|
1,664 |
|
4.14 |
% |
|
|
|
38,816 |
|
|
1,083 |
|
|
2.79 |
% |
|
Total interest-earning assets |
|
441,339 |
|
|
3,833 |
|
3.43 |
% |
|
|
|
533,318 |
|
|
3,746 |
|
2.77 |
% |
|
|
|
471,065 |
|
|
15,565 |
|
3.28 |
% |
|
|
|
593,772 |
|
|
11,734 |
|
|
1.96 |
% |
|
Securities lending revenue |
|
|
|
78 |
|
|
|
|
|
|
|
88 |
|
|
|
|
|
|
|
419 |
|
|
|
|
|
|
|
471 |
|
|
|
||||||||
|
Other interest revenue |
|
|
|
52 |
|
|
|
|
|
|
|
7 |
|
|
|
|
|
|
|
127 |
|
|
|
|
|
|
|
22 |
|
|
|
||||||||
|
Total interest-earning assets |
$ |
441,339 |
|
$ |
3,963 |
|
3.54 |
% |
|
|
$ |
533,318 |
|
$ |
3,841 |
|
2.84 |
% |
|
|
$ |
471,065 |
|
$ |
16,111 |
|
3.39 |
% |
|
|
$ |
593,772 |
|
$ |
12,227 |
|
|
2.04 |
% |
|
Funding sources |
|
|
|
|
|
|
|
|
|
|
|
|
|
|
|
|
|
|
|
|
|
|
|
|
|
|
|||||||||||||
|
Bank deposits |
$ |
280,380 |
|
$ |
971 |
|
1.37 |
% |
|
|
$ |
374,812 |
|
$ |
438 |
|
0.46 |
% |
|
|
$ |
306,505 |
|
$ |
3,363 |
|
1.10 |
% |
|
|
$ |
424,168 |
|
$ |
723 |
|
|
0.17 |
% |
|
Payables to brokerage clients |
|
61,781 |
|
|
66 |
|
0.43 |
% |
|
|
|
87,001 |
|
|
76 |
|
0.35 |
% |
|
|
|
66,842 |
|
|
271 |
|
0.41 |
% |
|
|
|
97,825 |
|
|
123 |
|
|
0.13 |
% |
|
Other short-term borrowings (3) |
|
6,724 |
|
|
95 |
|
5.63 |
% |
|
|
|
2,904 |
|
|
36 |
|
4.89 |
% |
|
|
|
7,144 |
|
|
375 |
|
5.25 |
% |
|
|
|
2,719 |
|
|
48 |
|
|
1.75 |
% |
|
Federal Home Loan Bank borrowings (3) |
|
31,630 |
|
|
423 |
|
5.28 |
% |
|
|
|
9,023 |
|
|
106 |
|
4.59 |
% |
|
|
|
34,821 |
|
|
1,810 |
|
5.14 |
% |
|
|
|
2,274 |
|
|
106 |
|
|
4.59 |
% |
|
Long-term debt |
|
25,457 |
|
|
226 |
|
3.54 |
% |
|
|
|
20,837 |
|
|
135 |
|
2.59 |
% |
|
|
|
22,636 |
|
|
715 |
|
3.16 |
% |
|
|
|
20,714 |
|
|
498 |
|
|
2.40 |
% |
|
Total interest-bearing liabilities |
|
405,972 |
|
|
1,781 |
|
1.74 |
% |
|
|
|
494,577 |
|
|
791 |
|
0.64 |
% |
|
|
|
437,948 |
|
|
6,534 |
|
1.49 |
% |
|
|
|
547,700 |
|
|
1,498 |
|
|
0.27 |
% |
|
Non-interest-bearing funding sources |
|
35,367 |
|
|
|
|
|
|
38,741 |
|
|
|
|
|
|
|
33,117 |
|
|
|
|
|
|
|
46,072 |
|
|
|
|
||||||||||
|
Securities lending expense |
|
|
|
51 |
|
|
|
|
|
|
|
20 |
|
|
|
|
|
|
|
147 |
|
|
|
|
|
|
|
48 |
|
|
|
||||||||
|
Other interest expense |
|
|
|
1 |
|
|
|
|
|
|
|
1 |
|
|
|
|
|
|
|
3 |
|
|
|
|
|
|
|
(1 |
) |
|
|
||||||||
|
Total funding sources |
$ |
441,339 |
|
$ |
1,833 |
|
1.65 |
% |
|
|
$ |
533,318 |
|
$ |
812 |
|
0.60 |
% |
|
|
$ |
471,065 |
|
$ |
6,684 |
|
1.41 |
% |
|
|
$ |
593,772 |
|
$ |
1,545 |
|
|
0.26 |
% |
|
Net interest revenue |
|
|
$ |
2,130 |
|
1.89 |
% |
|
|
|
|
$ |
3,029 |
|
2.24 |
% |
|
|
|
|
$ |
9,427 |
|
1.98 |
% |
|
|
|
|
$ |
10,682 |
|
|
1.78 |
% |
||||
Contacts
MEDIA:
Mayura Hooper
Charles Schwab
Phone: 415-667-1525
INVESTORS/ANALYSTS:
Jeff Edwards
Charles Schwab
Phone: 415-667-1524