Liquidity dictates how easily an asset can be bought or sold without affecting its price. When traders talk about good trading conditions, what they often mean is high liquidity.
A Liquidity Indicator is a metric, tool, or measurement designed to evaluate this essential market property. By tracking these indicators, traders and investors can judge market health, identify potential risks, avoid unnecessary slippage, and make informed decisions.
This article explores the meaning of liquidity, the role of liquidity indicators, and introduces popular ones you can use in your market analysis.
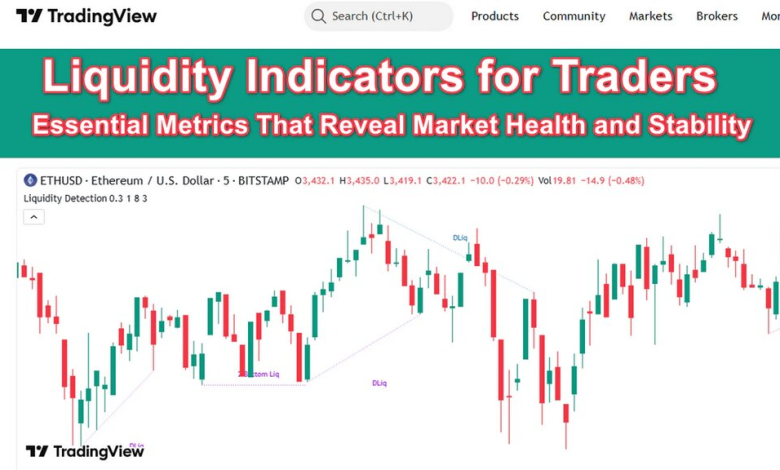
Alt: Liquidity Indicator
Caption: Identify potential risks and avoid unnecessary slippage with liquidity Indicators
What Is Liquidity?
Liquidity describes how quickly an asset can be exchanged for cash (or another asset) without a significant change in price.
A highly liquid asset can be traded immediately because it attracts both buyers and sellers in large volumes. A low-liquidity asset, however, can take longer to trade and often suffers from higher volatility when someone places a large order.
High Liquidity Assets:
- Major currency pairs (EUR/USD, USD/JPY)
- Blue-chip stocks (Apple, Microsoft, Amazon)
- Bitcoin and Ethereum during peak trading hours
- Gold and certain commodity futures
Low Liquidity Assets:
- Small-cap or micro-cap stocks
- Altcoins with small market caps
- Certain ETFs during off-market hours
- Real estate (high value but slow to liquidate)
Liquidity affects everything, from spreads to slippage to market manipulation risk. That is why traders rely heavily on various technical indicators to evaluate conditions before entering or exiting positions.
Key Concepts Behind Liquidity Indicators
To interpret liquidity indicators correctly, traders must understand the fundamental concepts that define how liquidity behaves in real markets. Below are three essential ideas that shape the logic behind all liquidity measurement tools:
Depth vs. Volume
Many traders mistakenly treat market depth and volume as the same thing, but they represent different forms of liquidity. Volume reflects past activity; it tells you how much trading has already occurred within a specific period.
High volume usually signals strong participation, but not necessarily strong liquidity in the present moment. Depth, on the other hand, shows the current and potential liquidity available in the order book.
It measures how many buy and sell orders are waiting at each price level, and therefore how much can be traded right now without causing price slippage. A healthy market typically requires both high volume (historical commitment) and deep order books (current capacity).
Tight Spreads
The bid-ask spread is one of the simplest yet most powerful reflections of liquidity. A narrow spread means buyers and sellers are actively competing, creating a tight range between the highest bid and lowest ask.
This indicates a liquid, efficient market where traders can enter or exit positions with minimal cost.
In contrast, a wide spread reveals uncertainty, weak participation, or fragmented interest, often seen during volatile events, off-hours, or in low-cap assets. Liquidity indicators often monitor spread behavior to evaluate whether market conditions are stable enough for reliable execution.
Resistance to Price Impact
One of the clearest signs of strong liquidity is a market’s ability to absorb large orders without dramatic price swings. This property, known as resistance to price impact, determines how much the price will move when institutional-sized orders enter the market.
If a market is highly liquid, even significant buying or selling pressure will only produce minimal movement because there are enough opposing orders to absorb the flow.
Liquidity indicators help quantify this sensitivity by analyzing order book density, sweep behavior, and how fast the price recovers after large trades. Understanding price impact allows traders to avoid slippage, identify stable environments, and recognize conditions where manipulation or stop-hunting is more likely.
Real Liquidity Indicators You Can Use
Below is a selection of widely recognized liquidity indicators, each functioning differently but all designed to measure market liquidity:
Liquidity Sweep Scanner Indicator (TradingFinder)
The Liquidity Sweep Scanner Indicator is more than just another TradingView tool. It’s an intelligent market analyzer designed to detect what most traders can’t see: hidden liquidity traps and reversal zones.
It focuses on liquidity events, moments where the price intentionally reaches areas filled with stop-loss orders. These events, known as liquidity sweeps, are often created by institutions collecting liquidity before sending the price in its real direction.
The indicator automatically locates these critical zones by analyzing swing highs/lows, reaction areas, and candle behavior, giving traders a clearer view of where false breakouts and potential reversals may form.
At its core, the scanner identifies where liquidity is pooled and how the market responds when these levels are breached. When price briefly breaks a major high or low and then snaps back, it signals that the move was designed to trigger stops rather than continue a breakout.
The Liquidity Sweep Scanner maps these situations in real time, marking reaction zones on the chart and highlighting where a sweep has likely occurred. This transforms complex smart-money concepts into a simple, visual system that can be used across markets, forex, stocks, indices, and commodities.
Why it matters:
- Reveals institutional behavior: Liquidity sweeps are rarely random; identifying them helps traders understand where large players are entering the market;
- Improves reversal detection: False breakouts often precede strong moves; spotting them early gives traders a strategic advantage;
- Reduces fakeout losses: Many traders lose money by chasing breakouts that are actually liquidity grabs; this indicator helps filter them out;
- Adds clarity to market structure: By marking liquidity pools and reaction zones, the tool provides a more accurate picture of where the market is likely to turn or accelerate.
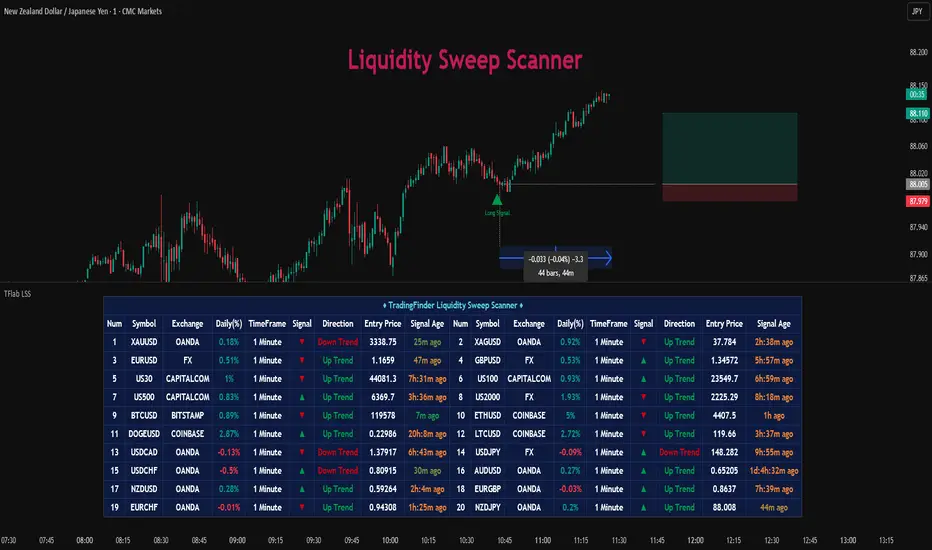
Alt: Liquidity Sweep Scanner Indicator
Caption: Improve reversal detection with the Liquidity Sweep Scanner Indicator
Bid-Ask Spread Indicator (Investopedia)
The bid-ask spread is one of the simplest yet most dependable ways to gauge market liquidity. It measures the difference between the highest price that buyers are willing to pay (the bid) and the lowest price that sellers are prepared to accept (the ask).
When this gap is narrow, it signals healthy liquidity: many buyers and sellers are actively competing, and trades can be executed with minimal friction.
When the spread widens, liquidity thins out, making execution more expensive and increasing the likelihood of slippage, especially during volatile news events or low-volume periods.
Why it matters:
- Reveals real-time liquidity conditions;
- Reflects competition and participation among buyers and sellers;
- Determines trading costs and influences slippage.
On-Balance Volume (OBV) Indicator (TradingView)
The On-Balance Volume (OBV) indicator uses cumulative volume to track whether buying or selling pressure is dominating the market.
Although originally developed as a trend-confirmation tool, it doubles as a liquidity indicator because it highlights whether market interest is expanding or shrinking.
Rising OBV suggests strong participation; trades are flowing in the same direction as the price, while falling OBV signals weakening conviction.
The strength of OBV lies in its ability to reveal liquidity shifts before major price movements occur, making it especially valuable in markets and equities where volume spikes often precede reversals or breakouts.
Why it matters
- Confirms whether volume supports ongoing price movements;
- Reflects market interest and trader participation;
- Reveals liquidity changes early, often before price reacts.
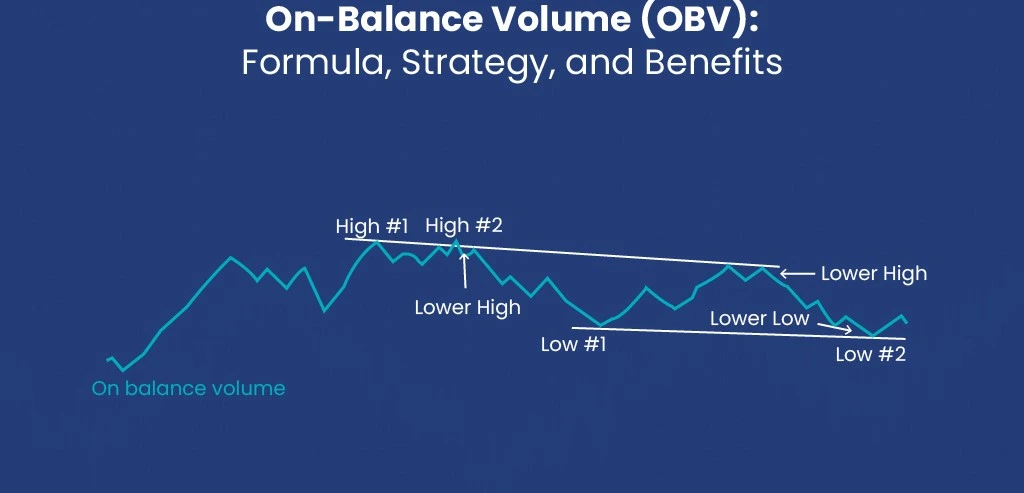 Alt: On Balance Volume (OBV) indicator
Caption: Reveal liquidity shifts with OBV indicator
Order Book Liquidity Metrics (Binance)
Order book depth offers one of the most transparent and accurate pictures of real liquidity. By showing the exact number of buy and sell orders stacked at various price levels, it allows traders to see how much demand or supply exists at any given moment.
A deep, well-balanced book indicates strong liquidity and reduces the risk of large trades moving the market. In contrast, a thin order book exposes fragility, prices can jump quickly with even moderate order flow.
Monitoring order book depth also helps traders detect manipulation techniques such as spoofing, sudden liquidity withdrawal, or artificial walls designed to deceive participants. Because it reflects real-time conditions, order book analysis is widely used by professional traders, scalpers, and algorithmic systems.
Why it matters
- Shows how much volume the market can absorb without major price impact;
- Helps detect manipulation attempts like spoofing or layering;
- Reveals whether liquidity is stable, increasing, or drying up.
Final Thoughts
Liquidity is the backbone of any functioning financial market. Understanding it and tracking it through reliable Liquidity Indicators helps traders execute better trades, avoid unnecessary risk, and interpret market stability accurately.
Whether you’re a beginner exploring trading for the first time or an experienced investor seeking deeper insight, monitoring liquidity indicators such as the bid-ask spread, OBV, and order book depth should be part of your routine.
They offer transparency into market movement, reveal hidden risks, and provide crucial context that raw price data cannot show. Markets thrive on liquidity, and traders thrive when they learn how to measure it.
FAQ
- What is a liquidity indicator?
A liquidity indicator measures how easily an asset can be bought or sold without affecting its price. It helps traders assess market health and execution risk.
- Why is liquidity important in trading?
High liquidity ensures smooth trade execution, tight spreads, and minimal slippage. Low liquidity increases volatility and the risk of market manipulation.
- How does the Liquidity Sweep Scanner help traders?
It identifies hidden liquidity zones and false breakouts, helping traders anticipate reversals and understand institutional market behavior.
- What is the difference between depth and volume?
Volume shows past trading activity, while depth reveals current and potential orders in the market. Both are essential to gauge true liquidity.
- Which markets benefit most from liquidity indicators?
Liquidity indicators are useful across forex, stocks, indices, and commodities. They provide insight wherever smooth order execution and market stability are critical.