Mathematical graphs have a long heritage in managing transport and routing issues, says database expert Aaron Holt. Now, Transport for London is using them to help make road travel as congestion-free as possible.
In 1736, a Swiss mathematician called Leonhard Euler worked on a puzzle he’d set himself: was there a truly optimal way to walk around his hometown by crossing each of its seven bridges once and only once?
It may seem a long way from this abstract thinking to London’s highly congested road network. But the fact that Euler solved this puzzle and created the whole domain of mathematics about networks and connections we call graph theory is proving highly useful to Transport for London (TfL).
Euler came up with the idea of representing the full complexity of a city in a representation schema where points represent a part of the city, and each line is a relationship between those parts. This approach makes it easy to identify routes between nodes but also represents any complex network in a simplified way.
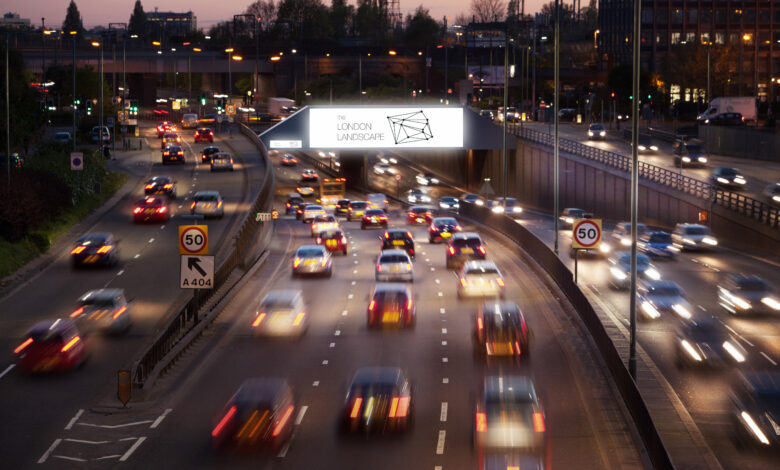
When TfL was trying to tackle the problem of heavy traffic build-up on London’s roads, it was natural for TfL to turn to graph technology. There is a serious cost to road congestion after all. Road congestion and slow-moving traffic set London back £5.1 billion per year in lost productivity. There’s also the stress and inconvenience for road users, pedestrians, and residents, plus the health and environmental impacts of the pollution all the stopped traffic generates.
Under its previous systems, TfL was taking between 14 and 17 minutes to detect a traffic incident. By the time any incident was spotted and interventions put in place, an average of 27 minutes had been lost in terms of traffic buildup. Andy Emmonds, the organisation’s Chief Transport Analyst, emphasises the major challenge in addressing this issue, especially considering there are 65,000-plus roads and that on an average day, there are around 5m road journeys despite the Tube.
A fresh approach to lifting the exhaust fume clouds
To tackle these challenges, Emmonds and his team wanted to bring together real-time data on all those roads. Their goal was to identify incidents proactively, not just when they flash up on CCTV at the TfL traffic control center, but before they escalate into issues. Swift reactions to incidents are crucial, given that London faces 20,000 unplanned transport incidents annually, and each minute left unaddressed means traffic builds.
Before the integration of a digital twin and graph technology, TfL’s Excel-based systems meant the organisation could only answer a small fraction of the traffic management team’s inquiries. Despite accumulating terabytes of data weekly, the main challenge stemmed from the storage and analysis methods rather than a lack of data. Due to these issues, meaningful conclusions based on the relationships within these datasets were unattainable.
Emmonds says two advanced forms of computer simulation and modeling are proving helpful: a digital twin and a form of advanced database technology, based on Euler’s theorem, graph technology.
As is well known, digital twins are virtual representations of physical reality. When executed well, they are as extensive and detailed as the reality they aim to capture, offering a practical way to model huge systems in real time. Not all digital twins are created equal, however. It turns out that the best data backbone for a digital twin is a graph database–more specifically, a graphs-based knowledge graph.
Graphs offer the best set of tools to support the advanced analytics and decision-making needed for gaining visibility into a network with as many moving parts as a major conurbation’s physical overground network.
A new graph-based traffic analytics console
This is because, in a graph database, the relationships between data points are stored in memory and on disk, creating a fabric of fully connected data that can be queried across multiple hops with millisecond response times. Native graph databases can also easily handle billions of relationships, which proves to be crucial in managing the London traffic situation.
According to Emmonds, “Trips and routing can only be efficiently managed through such a database, so we set up a test product which was fed data powered by graphs that could tell us in near real-time if there was a problem on the road. On the day of the test, the system detected five incidents that the control room didn’t pick up. For us, that was the proof.”
TfL has successfully integrated its datasets into the digital twin through the implementation of a new graph-based road traffic analytics console. In the mid-term, he says the solution will be at the center of a concerted plan to cut congestion by 10%. That will have a huge impact with £600m worth of productivity being returned to Londoners and the capital’s many visitors.
TfL plans to use the graph database and digital twin combination to support further data-based road traffic management innovation in the future, such as autonomous vehicles and smart city-style traffic handling.
And there are valuable lessons that extend far beyond the aim of improving road traffic management. If you’re thinking of trying to get a better handle on any complex, highly networked problem, then modeling it as a digital twin in a graph could help.


