This press release contains forward-looking information that is based upon assumptions and is subject to risks and uncertainties as indicated in the cautionary note contained within this press release. All dollar amounts are in Canadian dollars unless otherwise indicated.
TORONTO–(BUSINESS WIRE)–Dream Industrial Real Estate Investment Trust (DIR.UN-TSX) or (the “REIT” or “Trust” or “Dream Industrial REIT” or “DIR” or “we” or “us”) today announced its financial results for the three and six months ended June 30, 2025. Management will host a conference call to discuss the financial results on August 6, 2025 at 11:00 a.m. (ET).

“Dream Industrial reported a strong second quarter, delivering 4% FFO per Unit growth and 5% CP NOI growth driven by a 10% year-over-year increase in average in-place and committed rents in our comparative properties portfolio. We are encouraged by the increasing leasing momentum across our portfolio which lifted our committed occupancy to 96%, a 60 bps increase compared to last quarter and Q2 2024,” said Alexander Sannikov, President & Chief Executive Officer of Dream Industrial REIT. “We remain committed to disciplined capital allocation and are actively executing on our capital recycling strategy to enhance portfolio quality by re-investing in opportunities that drive long-term cash flow and NAV growth.”
HIGHLIGHTS
- Diluted funds from operations (“FFO”) per Unit(1) was $0.26 in Q2 2025, a 4.1% increase when compared to $0.25 in Q2 2024.
- Comparative properties net operating income (“CP NOI”) (constant currency basis)(2) was $100.3 million in Q2 2025, a 5.0% increase when compared to $95.5 million in Q2 2024.
- In-place and committed occupancy was 96.0% as at June 30, 2025, a 60 bps increase when compared to 95.4% as at March 31, 2025.
- Closed on over $80 million of acquisitions in the Trust’s wholly-owned portfolio and $460 million of acquisitions through the Trust’s private ventures since the beginning of 2025, adding over 1.6 million square feet of GLA and over 31 acres of land to the Trust’s owned and managed portfolio.
- Signed over 3.3 million square feet of new leases and renewals across the Trust’s wholly-owned portfolio at an average rental spread of 20% from the beginning of Q2 until July 31, 2025, driven by 41% spread in Ontario, 52% spread in Québec and 11% spread in Western Canada.
- Addressed over 70% of the total debt maturity of $850 million due in 2025, and currently evaluating various alternatives for the remaining maturity.
- Net rental income was $94.7 million in Q2 2025, an 8.0% increase when compared to $87.7 million in Q2 2024, driven by 8.6% in Ontario, 4.0% in Québec, 19.0% in Western Canada and 9.1% in Europe, excluding disposed investment properties.
- Net income was $46.6 million in Q2 2025, a 24.4% decrease when compared to $61.6 million in Q2 2024. The net income in Q2 2025 was comprised of net rental income of $94.7 million, fair value loss in investment properties of $6.5 million, fair value loss in financial instruments of $7.0 million and other net expenses of $34.6 million.
- Total assets were $8.3 billion as at June 30, 2025, a 1.8% increase when compared to $8.1 billion as at December 31, 2024, driven by investments in the Dream Summit JV(3) and development projects, partially offset by the disposition of certain non-core assets.
- Purchased for cancellation 1,918,566 REIT Units under the normal course issuer bid (“NCIB”) program at a weighted average price of $10.42 per REIT Unit.
|
1. |
Diluted FFO per Unit is a non-GAAP ratio. For further information on this non-GAAP ratio, please refer to the statements under the heading “Non-GAAP financial measures, ratios and supplementary financial measures” in this press release. |
|
|
2. |
CP NOI (constant currency basis) and Total equity (including LP B Units) are non-GAAP financial measures. The tables included in the Appendices section of this press release reconcile these non-GAAP financial measures with their most directly comparable IFRS financial measures. For further information on this non-GAAP financial measure, please refer to the statements under the heading “Non-GAAP financial measures, ratios and supplementary financial measures” in this press release. |
|
|
3. |
A joint venture between GIC and the Trust in which the Trust has a 10% interest. |
FINANCIAL HIGHLIGHTS
|
SELECTED FINANCIAL INFORMATION |
|
|
|
|
|
|
|
|
|
(unaudited) |
Three months ended |
|
Six months ended |
|||||
|
|
|
June 30, |
|
June 30, |
|
June 30, |
|
June 30, |
|
(in thousands of dollars except per Unit amounts) |
|
2025 |
|
2024 |
|
2025 |
|
2024 |
|
Operating results |
|
|
|
|
|
|
|
|
|
Net rental income |
$ |
94,699 |
$ |
87,654 |
$ |
186,409 |
$ |
173,515 |
|
Comparative properties net operating income (“NOI”) (constant currency basis)(1) |
$ |
100,260 |
$ |
95,453 |
$ |
196,626 |
$ |
188,825 |
|
Net income |
$ |
46,608 |
$ |
61,572 |
$ |
94,096 |
$ |
136,147 |
|
Funds from operations (“FFO”)(2) |
$ |
74,835 |
$ |
71,053 |
$ |
149,437 |
$ |
140,356 |
|
FFO – diluted per Unit(3)(4) |
$ |
0.26 |
$ |
0.25 |
$ |
0.51 |
$ |
0.49 |
|
Distribution rate per Unit |
$ |
0.17 |
$ |
0.17 |
$ |
0.35 |
$ |
0.35 |
|
FFO payout ratio(3) |
|
68.7% |
|
71.6% |
|
68.9% |
|
72.4% |
|
See footnotes at end. |
|
|
|
|
|
|
|
|
|
PORTFOLIO INFORMATION |
|
|
|
|
|
|
|
|
|
As at |
||||
|
|
|
June 30, |
|
December 31, |
|
June 30, |
|
(in thousands of dollars) |
|
2025 |
|
2024 |
|
2024 |
|
Total portfolio |
|
|
|
|
|
|
|
Number of assets(5)(6) |
|
338 |
|
335 |
|
339 |
|
Investment properties fair value |
$ |
7,267,008 |
$ |
7,031,713 |
$ |
6,962,841 |
|
Gross leasable area (“GLA”) (in millions of sq. ft.)(6) |
|
72.9 |
|
71.8 |
|
71.9 |
|
Occupancy rate – in-place and committed (period-end)(7) |
|
96.0% |
|
95.8% |
|
95.4% |
|
Occupancy rate – in-place (period-end)(7) |
|
94.1% |
|
95.3% |
|
95.0% |
|
See footnotes at end. |
|
|
|
|
|
|
|
FINANCING AND CAPITAL INFORMATION |
|
|
|
|
|
|
|
(unaudited) |
|
As at |
||||
|
|
|
June 30, |
|
December 31, |
|
June 30, |
|
(in thousands of dollars except per Unit amounts) |
|
2025 |
|
2024 |
|
2024 |
|
FINANCING |
|
|
|
|
|
|
|
Credit rating – DBRS |
|
BBB (mid) |
|
BBB (mid) |
|
BBB (mid) |
|
Net total debt-to-total assets (net of cash and cash equivalents) ratio(8) |
|
38.0% |
|
36.1% |
|
35.9% |
|
Net total debt-to-normalized adjusted EBITDAFV ratio (years)(9) |
|
8.2 |
|
7.0 |
|
8.1 |
|
Interest coverage ratio (times)(10) |
|
5.1 |
|
5.2 |
|
5.4 |
|
Weighted average face interest rate on debt (period-end) |
|
2.77% |
|
2.47% |
|
2.47% |
|
Unencumbered investment properties (period-end)(11) |
$ |
6,092,347 |
$ |
5,799,700 |
$ |
5,683,435 |
|
Unencumbered investment properties as a percentage of investment properties(11) |
|
83.8% |
|
82.3% |
|
81.6% |
|
Total assets |
$ |
8,269,717 |
$ |
8,122,554 |
$ |
8,019,581 |
|
Cash and cash equivalents |
$ |
42,595 |
$ |
80,277 |
$ |
103,358 |
|
Available liquidity(12) |
$ |
714,402 |
$ |
822,395 |
$ |
596,253 |
|
CAPITAL |
|
|
|
|
|
|
|
Total equity (per condensed consolidated financial statements) |
$ |
4,784,272 |
$ |
4,731,073 |
$ |
4,666,106 |
|
Total equity (including LP B Units)(13) |
$ |
4,872,149 |
$ |
4,888,696 |
$ |
4,835,207 |
|
Total number of Units (in thousands)(14) |
|
291,907 |
|
291,167 |
|
289,019 |
|
Net asset value (“NAV”) per Unit(15) |
$ |
16.69 |
$ |
16.79 |
$ |
16.73 |
|
Unit price |
$ |
11.79 |
$ |
11.81 |
$ |
12.67 |
|
See footnotes at end. |
|
|
|
|
|
|
ORGANIC GROWTH
-
Continued strong leasing momentum at attractive rental spreads – From April 1, 2025 through to July 31, 2025, the Trust has transacted 3.3 million square feet of leases across its wholly-owned portfolio at a weighted average rental rate spread of 20.0% over prior or expiring rents.
- In Canada, the Trust signed 1.6 million square feet of leases, achieving a weighted average rental rate spread to expiry of 38.5% and an average annual contractual rent growth of 3.2%.
- In Europe, the Trust signed 1.6 million square feet of leases at rates that are on average in line with prior rents. All of the leases are fully indexed to local consumer price indices (“CPI”) or have contractual rent steps.
The Trust’s average in-place and committed rents in Canada have grown by 6.8% since the start of 2025 to June 30, 2025. As at June 30, 2025, estimated market rents exceeded the average in-place and committed rents by 22.9% and 4.6% across the Trust’s wholly-owned portfolio in Canada and Europe, respectively. Along with capturing substantial rental rate growth, the Trust systematically adds contractual annual rental rate escalators to its leases resulting in consistently growing CP NOI (constant currency basis) over time. Currently, the average contractual annual rental rate growth embedded in the Trust’s Canadian portfolio equates to 3.2%. In the Trust’s European portfolio, approximately 85% of the leases are indexed to the local CPI with the remainder of the portfolio having contractual rent steps.
-
Solid pace of CP NOI (constant currency basis)(1) growth – CP NOI (constant currency basis) for the three and six months ended June 30, 2025 was $100.3 million and $196.6 million, respectively. For the same periods in 2024, CP NOI (constant currency basis) was $95.5 million and $188.8 million, respectively. This represents an increase of 5.0% and 4.1% for the three and six months ended June 30, 2025, respectively, compared to the prior year comparative periods.
The Canadian portfolio posted year-over-year CP NOI (constant currency basis) growth of 8.0% for the three months ended June 30, 2025, driven by 11.5%, 4.7% and 4.3% CP NOI growth in Ontario, Québec and Western Canada, respectively. Overall, in-place base rents for the Canadian portfolio increased by 13.2% and 11.9% for the three and six months ended June 30, 2025, respectively. The Trust’s strong leasing momentum has led to robust in-place base rent growth over the past few years, with a compounded annual growth rate of over 9% over the past three years.
In Europe, year-over-year CP NOI (constant currency basis) increased by 1.5% for the three months ended June 30, 2025. The increase was driven by higher rental rates on new and renewed leases, in addition to CPI indexation.
- Healthy occupancy levels – The Trust’s in-place and committed occupancy was 96.0% as at June 30, 2025, a 60 basis points (“bps”) increase from 95.4% as at March 31, 2025. The Trust continues to be in active discussions with prospective tenants and it expects significant opportunities to capture strong income growth as spaces are leased.
- Growing property management and leasing platform – The Trust’s private ventures have completed over $1 billion of acquisitions over the past 24 months. Net property management and leasing margin for the three and six months ended June 30, 2025 was $3.1 million and $6.1 million, respectively, representing an increase of $0.5 million or 21.3%, and $1.0 million or 20.1%, respectively, relative to the comparative prior year periods. The increase was driven by organic revenue growth and the increase in scale of the private ventures in 2025 and 2024.
- Continued growth in net rental income for the quarter – Net rental income for the three and six months ended June 30, 2025 was $94.7 million and $186.4 million, respectively, representing an increase of $7.0 million or 8.0%, and $12.9 million or 7.4%, respectively, relative to the comparative prior year periods. For the quarter, year-over-year net rental income increased by 8.6% in Ontario, 4.0% in Québec, 19.0% in Western Canada and 9.1% in Europe, excluding disposed investment properties. The increase was mainly driven by strong CP NOI (constant currency basis) growth over the past year, early lease renewals and lease-up at the Trust’s development projects.
ACQUISITIONS AND DISPOSITIONS UPDATE
During the quarter, the Trust acquired a 178,000 square foot asset located in the Netherlands for a purchase price of $19 million. The multi-tenanted asset is located on a 4.8-acre site adjacent to the A1 motorway and well-located in the geographic centre of the Netherlands. With approximately 80% of the space rolling in mid-2025, the Trust intends to pursue a value-add redevelopment strategy and capture the mark-to-market upside, with an expected NOI yield on purchase price of 9.9% (and 8.5% when including redevelopment capital) upon stabilization.
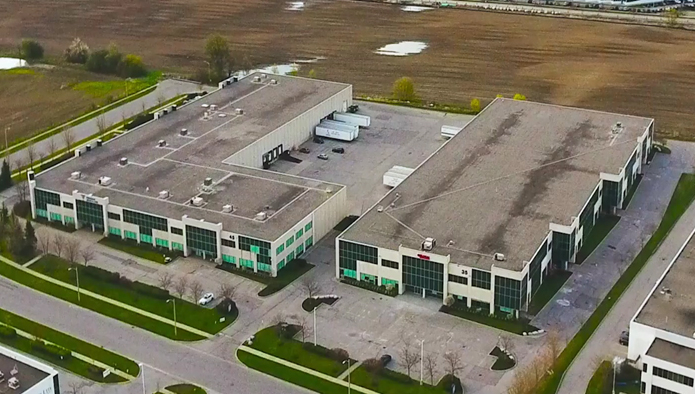
Subsequent to the quarter, the Trust acquired a 192,000 square foot asset located in the Greater Toronto Area (“GTA”) North industrial sub-market for a purchase price of $60 million representing a going-in cap rate of approximately 6%. The asset comprises two buildings situated on over 10 acres of land, offering excellent connectivity across the GTA and benefits from operational synergies through the Trust’s active presence in the node. The asset is fully leased to four tenants with 3% contractual rent steps and strong mark-to-market upside.
See Figure 1, Richmond Hill, Ontario
“Our recent acquisition in Richmond Hill strengthens DIR’s strategic footprint in the GTA North. With 550,000 square feet of existing assets located nearby in this node, we are well positioned to leverage property management and leasing synergies. Two of the occupiers have recently committed to long-term leases and the remaining two leases are expected to roll at a positive spread to expiry, translating into an expected compounded annual NOI growth of over 5% over the next five years,” said Bruce Traversy, Chief Investment Officer of Dream Industrial REIT. “We continue to observe strong user occupier and investor demand in the GTA North, one of Canada’s tightest industrial submarkets where we maintain strong conviction given its low availability and strong barriers to new supply due to prohibitive replacement costs. We have seen increased interest from users and local investors for our assets in the node, at substantially higher capital values than this acquisition.”
The Trust continues to pursue disposition opportunities as part of its ongoing capital recycling program. Currently, the Trust has approximately $100 million of assets under letters of intent or in advanced negotiations with both users and investors across its wholly-owned portfolio and private ventures.
As previously disclosed, the Dream Summit JV completed the acquisition of an asset in Oakville, Ontario, for a purchase price of $59 million ($5.9 million at DIR’s share) during the second quarter. Subsequent to the quarter, the Dream Summit JV disposed of a non-strategic asset in Western Canada totalling $18.7 million ($1.9 million at DIR’s share) at a 15% premium to IFRS value.
DEVELOPMENT LEASING UPDATE
The Trust continues to see healthy leasing pipeline for its development projects. The Trust is currently engaged in various stages of negotiations for 1.7 million square feet of new leases (0.8 million square feet at the Trust’s share) across developments within its wholly-owned portfolio and private ventures in Canada.
During the quarter, the Trust signed a lease at its 225,000 square foot property located near the port of Montréal for approximately 35% of the space with an existing tenant in its European portfolio. This lease anchors the redevelopment strategy for the asset as the Trust continues to advance its plans to enhance the functionality and long-term value of this property.
The Trust continues to see strong interest from its existing occupiers to expand their existing footprints, allowing the Trust to leverage its extensive excess land portfolio. Over the course of 2025, the Trust has commenced or substantially advanced negotiations on over 0.5 million square feet of expansion projects (0.3 million square feet at the Trust’s share) for its existing tenants at an expected yield on cost of over 8%.
VALUE-ADD INITIATIVES UPDATE
The Trust continues to advance its solar program and commenced construction on five new projects across Alberta, Ontario and Germany.
During the quarter, the Trust purchased the existing rooftop solar system at an asset in Ottawa, Ontario, from the previous owner, and began construction to repower and upgrade the system to increase energy generation. In July, construction was substantially completed and the system is now fully operational, adding over 2,900 panels and delivering 1.2 MW of capacity. The Trust expects to achieve a yield on cost of 20%.
Furthermore, the Trust has identified an opportunity to repower existing solar installations at an asset in Ontario that will enhance revenue generation by more than doubling the system capacity to 0.9 MW, with an expected yield on cost of 23%.
Additionally, the Trust’s current solar feasibility pipeline comprises over 80 projects, translating into over $100 million of potential additional investment volume at a targeted yield on cost of over 8% over the near to medium-term.
CAPITAL STRATEGY
The Trust continues to maintain significant financial flexibility as it executes on its strategic initiatives. The Trust’s proportion of secured debt(16) is 5.4% of total assets and represents 14.1% of total debt(17). The Trust’s unencumbered asset pool(11) totalled $6.1 billion as at June 30, 2025, representing 83.8% of the Trust’s total investment properties value as at June 30, 2025.
During the quarter, the Trust purchased for cancellation 1,918,566 REIT Units under the NCIB at a weighted average price of $10.42 per REIT Unit for a total cost of $20.0 million.
The Trust ended Q2 2025 with available liquidity(12) of $714.4 million, including $42.6 million of cash and cash equivalents, and an additional $250 million that could be exercised through the accordion on its unsecured revolving credit facility. The Trust’s net total debt-to-normalized adjusted EBITDAFV ratio was 8.2x and net total debt-to-total assets (net of cash and cash equivalents) ratio was 38.0% as at June 30, 2025.
Subsequent to the quarter, the Trust closed on its issuance of $200 million of Series G unsecured debentures at an all-in interest rate of 4.287% per annum. The Trust has entered into forward cross-currency interest rate swap arrangements to swap the proceeds to euros to lower the effective fixed interest rate to 3.726% per annum starting December 22, 2025. The net proceeds were utilized to repay existing indebtedness, including to pre-fund the repayment of indebtedness that will mature in December 2025, and for general Trust purposes.
“Consistent with our strategy to enhance our balance sheet strength, we have now effectively addressed over 70% of our 2025 debt maturities at rates in line or better than our expectations at the beginning of the year,” said Lenis Quan, Chief Financial Officer of Dream Industrial REIT. “Pro forma this bond offering, our total available liquidity of over $900 million increases our financial flexibility and positions us well to execute on our strategic initiatives.”
CONFERENCE CALL
Senior management will host a conference call to discuss the financial results on Wednesday, August 6, 2025, at 11:00 a.m. (ET). To access the conference call, please dial 1-833-752-4413 in Canada or 647-849-3202 elsewhere. To access the conference call via webcast, please go to Dream Industrial REIT’s website at www.dreamindustrialreit.ca and click on the link for News, then click on Events. A taped replay of the conference call and the webcast will be available for ninety (90) days following the call.
Other information
Information appearing in this press release is a select summary of financial results. The condensed consolidated financial statements and management’s discussion and analysis for the Trust will be available at www.dreamindustrialreit.ca and on www.sedarplus.com.
Dream Industrial REIT is an owner, manager and operator of a global portfolio of well-located, diversified industrial properties. As at June 30, 2025, the REIT has an interest in and manages a portfolio which comprises 338 industrial assets (550 buildings) totalling approximately 72.9 million square feet of gross leasable area in key markets across Canada, Europe, and the U.S. The REIT’s objective is to deliver strong total returns to its unitholders through secure distributions as well as growth in net asset value and cash flow per unit underpinned by its high-quality portfolio and an investment grade balance sheet. Dream Industrial REIT is an unincorporated, open-ended real estate investment trust. For more information, please visit www.dreamindustrialreit.ca.
|
FOOTNOTES |
||
|
1. |
CP NOI (constant currency basis) is a non-GAAP financial measure. The most directly comparable financial measure to CP NOI (constant currency basis) is net rental income. The table included in the Appendices section of this press release reconcile CP NOI (constant currency basis) for the three and six months ended June 30, 2025 and June 30, 2024 to net rental income. For further information on this non-GAAP measure, please refer to the statements under the heading “Non-GAAP financial measures, ratios and supplementary financial measures” in this press release. |
|
|
2. |
FFO is a non-GAAP financial measure. The most directly comparable financial measure to FFO is net income. The tables included in the Appendices section of this press release reconcile FFO for the three and six months ended June 30, 2025 and June 30, 2024 to net income. For further information on this non-GAAP measure, please refer to the statements under the heading “Non-GAAP financial measures, ratios and supplementary financial measures” in this press release. |
|
|
3. |
Diluted FFO per Unit and FFO payout ratio are non-GAAP ratios. Diluted FFO per Unit is comprised of FFO (a non-GAAP financial measure) divided by the weighted average number of Units. FFO payout ratio is calculated as total distributions divided by FFO (both non-GAAP financial measures) for the period. For further information on non-GAAP ratios, please refer to the statements under the heading “Non-GAAP financial measures, ratios and supplementary financial measures” in this press release. |
|
|
4. |
A description of the determination of diluted amounts per Unit can be found in the Trust’s Management’s Discussion and Analysis for the three and six months ended June 30, 2025 and June 30, 2024, in the section “Supplementary financial measures and ratios and other disclosures”, under the heading “Weighted average number of Units”. |
|
|
5. |
“Number of assets” comprise a building, or a cluster of buildings in close proximity to one another attracting similar tenants. |
|
|
6. |
Includes the Trust’s owned and managed properties as at June 30, 2025, December 31, 2024 and June 30, 2024. |
|
|
7. |
Includes the Trust’s share of equity accounted investments as at June 30, 2025, December 31, 2024 and June 30, 2024. |
|
|
8 |
Net total debt-to-total assets (net of cash and cash equivalents) ratio is a non-GAAP ratio. Net total debt-to-total assets (net of cash and cash equivalents) ratio is comprised of net total debt (a non-GAAP financial measure) divided by total assets (net of cash and cash equivalents) (a non-GAAP financial measure). The most directly comparable IFRS financial measure to net total debt is non-current debt, and the most directly comparable IFRS financial measure to total assets (net of cash and cash equivalents) is total assets. The tables included in the Appendices section of this press release reconcile net total debt to non-current debt and total assets (net of cash and cash equivalents) to total assets as at June 30, 2025, December 31, 2024 and June 30, 2024. For further information on this non-GAAP ratio and these non-GAAP financial measures, please refer to the statements under the heading “Non-GAAP financial measures, ratios and supplementary financial measures” in this press release. |
|
|
9. |
Net total debt-to-normalized adjusted EBITDAFV is a non-GAAP ratio. Net total debt-to-normalized adjusted EBITDAFV is comprised of net total debt (a non-GAAP financial measure) divided by normalized adjusted EBITDAFV (a non-GAAP financial measure). The most directly comparable IFRS financial measure to normalized adjusted EBITDAFV is net income. The tables included in the Appendices section of this press release reconcile adjusted EBITDAFV to net income (loss) for the three months ended June 30, 2025, December 31, 2024 and June 30, 2024; for the six months ended June 30, 2025, June 30, 2024 and June 30, 2023; and for the years ended December 31, 2024 and December 31, 2023. For further information on this non-GAAP ratio and this non-GAAP financial measure, please refer to the statements under the heading “Non-GAAP financial measures and ratios and supplementary financial measures” in this press release. |
|
|
10. |
Interest coverage ratio is a non-GAAP ratio. Interest coverage ratio is comprised of trailing 12-month period adjusted EBITDAFV (a non-GAAP financial measure) divided by trailing 12-month period interest expense on debt and other financing costs. The most directly comparable IFRS financial measure to adjusted EBITDAFV is net income. For further information on this non-GAAP ratio and non-GAAP financial measure, please refer to the statements under the heading “Non-GAAP financial measures and ratios and supplementary financial measures” in this press release. |
|
|
11. |
Unencumbered investment properties and unencumbered investment properties as a percentage of total investment properties are supplementary financial measures. For further information on these supplementary financial measures, please refer to the statements under the heading “Non-GAAP financial measures, ratios and supplementary financial measures” in this press release. |
|
|
12. |
Available liquidity is a non-GAAP financial measure. The most directly comparable financial measure to available liquidity is cash and cash equivalents. The tables included in the Appendices section of this press release reconcile available liquidity to cash and cash equivalents as at June 30, 2025, December 31, 2024 and June 30, 2024. For further information on this non-GAAP financial measure, please refer to the statements under the heading “Non-GAAP financial measures, ratios and supplementary financial measures” in this press release. |
|
|
13. |
Total equity (including LP B Units or subsidiary redeemable units) is a non-GAAP financial measure. The most directly comparable financial measure to total equity (including LP B Units) is total equity (per condensed consolidated financial statements). The tables included in the Appendices section of this press release reconcile total equity (including LP B Units) to total equity (per condensed consolidated financial statements) as at June 30, 2025, December 31, 2024 and June 30, 2024. For further information on this non-GAAP measure, please refer to the statements under the heading “Non-GAAP financial measures, ratios and supplementary financial measures” in this press release. |
|
|
14. |
Total number of Units includes 7.5 million LP B Units that are classified as a liability under IFRS Accounting Standards. |
|
|
15. |
NAV per Unit is a non-GAAP ratio. NAV per Unit is comprised of total equity (including LP B Units) (a non-GAAP financial measure) divided by the total number of Units. For further information on this non-GAAP ratio, please refer to the statements under the heading “Non-GAAP financial measures, ratios and supplementary financial measures” in this press release. |
|
|
16. |
Secured debt is a supplementary financial measure and secured debt as a percentage of total assets is a supplementary financial ratio. Please refer to the statements under the heading “Non-GAAP financial measures, ratios and supplementary financial measures” in this press release. |
|
|
17. |
Total debt is a non-GAAP financial measure. The most directly comparable financial measure to total debt is non-current debt. The tables included in the Appendices section of this press release reconcile total debt to non-current debt as at June 30, 2025, December 31, 2024 and June 30, 2024. For further information on this non-GAAP financial measure, please refer to the statements under the heading “Non-GAAP financial measures, ratios and supplementary financial measures” in this press release. |
|
Contacts
Dream Industrial REIT
Alexander Sannikov
President & Chief Executive Officer
(416) 365-4106
[email protected]
Lenis Quan
Chief Financial Officer
(416) 365-2353
[email protected]