The scale and complexity of cloud platforms have reached a point where simple monitoring is no longer enough. Distributed systems produce enormous volumes of data, which often obscures the real reasons behind failures or slowdowns.
Traditional observability tools can reveal what happened and when, but fall short in explaining why incidents occur or how to address them. Without context, engineers are left treating symptoms while root causes persist. By the time a pattern becomes clear, its impact can extend across critical services and affect business outcomes.
Addressing this requires more than detection. Observability frameworks must provide context and demonstrate how incidents impact both technology and business. AI-driven cognitive observability delivers on this, shifting monitoring from just collecting data to enabling systems that reason, infer, and improve performance.
This article defines the cognitive layer of cloud intelligence, explains how it functions, and shows why it’s essential for resilience in modern platforms.
The Next Layer: Cognitive Observability
Traditional observability focuses on streams of logs, numerical metrics, and distributed traces. This approach gives operational teams a sense of system activity and performance by answering “what happened” and “when,” but often misses connections that explain “why.”
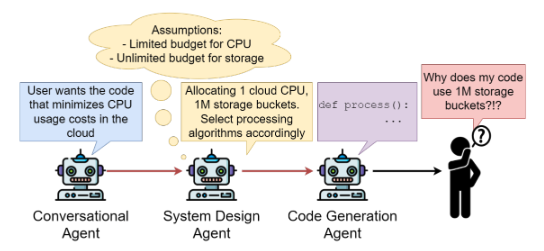
In multi-agent systems, errors made by early agents may only manifest later in the workflow.
As cloud systems have grown and the DevOps approach has matured, observability has become an integral part of development. Teams have better tools for signal capture, but as system complexity increases, indicators such as CPU spikes or error clusters often fail to reveal the underlying cause or predict how the issue will develop. Connections between technical events and their business effects frequently remain hidden within layers of telemetry.
Cognitive observability addresses these gaps by introducing reasoning capabilities. It uses a multi-modal approach that integrates information across telemetry streams, code execution paths, event patterns, correlations, and customer impacts. This framework interprets relationships, uncovers sources of disruption, and anticipates possible outcomes, helping teams understand both symptoms and their upstream causes.
| Dimension | Traditional Observability | Cognitive Observability |
| Data Sources | Logs, metrics, traces | Logs, metrics, traces, event patterns, customer impact |
| Detection | Rule-based alerts | AI-based, adaptive anomaly detection |
| Diagnosis | Manual investigation, symptom-focused | Automated root cause analysis, context-driven |
| Context | Limited, technical signals only | Includes technical context and business impact |
| Outcome | Alerts for failures, symptom mitigation | Explanations, predictions, actionable guidance |
When applied, cognitive observability can link a surge in latency, a configuration change, and a spike in support requests. This identifies not just the immediate problem but what set it in motion.
Architecting the Cognitive Layer
Building this layer means combining AI with established data pipelines. The main elements are:
Data Pipelines
Cloud-native systems generate large volumes of telemetry that must be quickly collected, processed, and stored for effective observability. Modern observability architectures use dedicated data collectors to aggregate and route telemetry into backend storage, supporting both real-time and historical analysis.
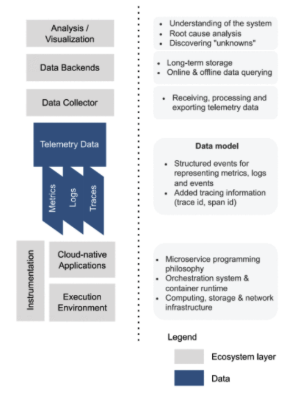
The observability ecosystem
In enterprise cloud environments, platforms such as CosmosDB, Azure Data Explorer, and Kafka efficiently handle telemetry ingestion and transformation at a large scale. Their design enables them to keep pace with dynamic workloads and integrate seamlessly with various monitoring tools.
AI-Based Anomaly Prediction
Early detection of problems depends on recognizing shifts in behavior. Machine learning models, trained on historical and real-time data, identify outliers that may signal new risks. Azure Stream Analytics, for example, applies these models directly within the data pipeline, flagging unexpected spikes or drops without requiring human intervention to set rules.
This approach accelerates detection and ensures consistency. Instead of relying on a fixed set of alarms, systems can adapt to new patterns as they emerge, catching subtle shifts before they escalate into larger incidents.
Root Cause Analysis (RCA)
Modern platforms utilize models that can scan large volumes of logs, traces, and dependency graphs, connecting symptoms to their actual origins. If a misconfigured load balancer disrupts several applications, AI can sift through logs and traces to locate the source.
One example is RCACopilot. Introduced by the Microsoft Research team, this approach combines automated data collection with large language models to predict root-cause categories and generate clear explanations. Each alert prompts the correct handler, gathers targeted data, and delivers a focused diagnosis.
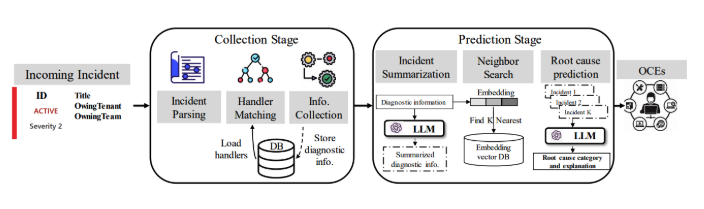
RCACopilot architecture
Source: Automatic Root Cause Analysis via Large Language Models for Cloud Incidents | Y. Chen et al.
When these systems incorporate feedback from engineers and real-world incidents, models adjust and improve. Reviewing and correcting suggestions, or supplementing them with customer insights, ensures that future detection and diagnosis remain accurate and practical.
Case Insight: Cognitive Observability in High-Demand E-Commerce
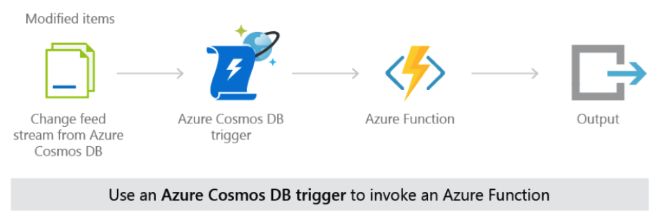
A high-demand e-commerce application offers a practical example of cognitive observability in action. During peak sales events, the system needs to handle rapid spikes in activity. Azure Functions process orders, payments, and notifications, while CosmosDB ensures quick access to product and order data across regions.
The platform’s event-driven setup, where CosmosDB triggers invoke Azure Functions for every order or inventory update, keeps operations real-time but introduces complexity. A small fault, like a delay in one region, can quickly degrade customer experience.
Dynamic Scaling in Azure Functions
When customers report failed checkouts or slow payment confirmations, cognitive observability turns the flood of raw telemetry into a clear, reasoned explanation. AI models analyze diverse data sources together:
- System metrics show Azure Function execution times rising.
- Database telemetry detects write contention in a specific regional node.
- Customer analytics reveal that transaction failures cluster within that region.
The cognitive layer then reasons across these patterns, linking cause to effect: a misconfigured endpoint led to cascading timeouts during checkout. The system automatically generates a root-cause explanation, connecting the customer symptom (failed checkout) to the underlying system trigger (misconfiguration) without manual correlation.
This example shows cognitive observability’s defining feature: contextual reasoning. Traditional observability tools could flag latency or log errors, but would not explain how those signals relate to user impact. The cognitive model interprets telemetry as a narrative. It infers what happened, why it happened, and which layer of the system caused it.
In doing so, it moves observability from passive detection to active understanding, converting dispersed technical data into insight that directly reflects business outcomes and customer experience.
Human-AI Collaboration
Image: Robot and human hands reaching toward an AI hologram by Summit Art Creations | Shutterstock
AI-powered observability tools change the way engineers work. Instead of searching through raw data and endless dashboards, teams receive concise summaries and suggested actions. When issues arise, the system connects related events and presents a clear timeline for investigation.
The technology delivers recommendations, highlights likely causes, and estimates business impact, but people remain at the center of decisions. They review findings, apply their expertise, and choose responses. By working together, human skill and automated insights transform scattered data into practical solutions.
For example, when a critical service slows down, the cognitive layer brings together traces, metrics, and customer feedback. The platform can identify likely root causes and suggest fixes based on historical patterns, allowing engineers to focus on relevant factors and resolve problems efficiently and quickly.
This shift lets engineering teams focus less on reactive investigation and more on proactive improvement. As a result, organizations handle incidents more effectively and build greater confidence in their platforms.
Conclusion: The Path to Self-Aware Infrastructure
Cognitive observability is changing the way cloud operations are managed. By incorporating reasoning, prediction, and learning, cloud platforms develop a fundamental understanding of their own health and respond to incidents as they happen. Over time, these systems adjust and improve based on each new event.
The future of observability will be transformed by the ability to connect system events with business outcomes, support regulatory requirements, and make diagnostics more accessible to engineers. As platforms become easier to use with conversational interfaces and actionable insights, teams will spend less time sorting through data and more time building reliable, intelligent services.
Organizations that build these capabilities will set new expectations for reliability and service quality. Adopting cognitive observability is a practical step for any group seeking to enhance the responsiveness and dependability of cloud systems.