At ObservabilityCON 2025, Grafana Labs, a leading observability provider, sketched out a bold vision for the observability landscape — intelligent, cost-aware, and deeply integrated across all telemetry domains.
Below we break down the major new features of the company’s open observability cloud, Grafana Cloud. We also consider what problems they aim to solve, and why they may reshape how teams monitor and operate complex systems.
Key Announcements: What’s New in Grafana Cloud?
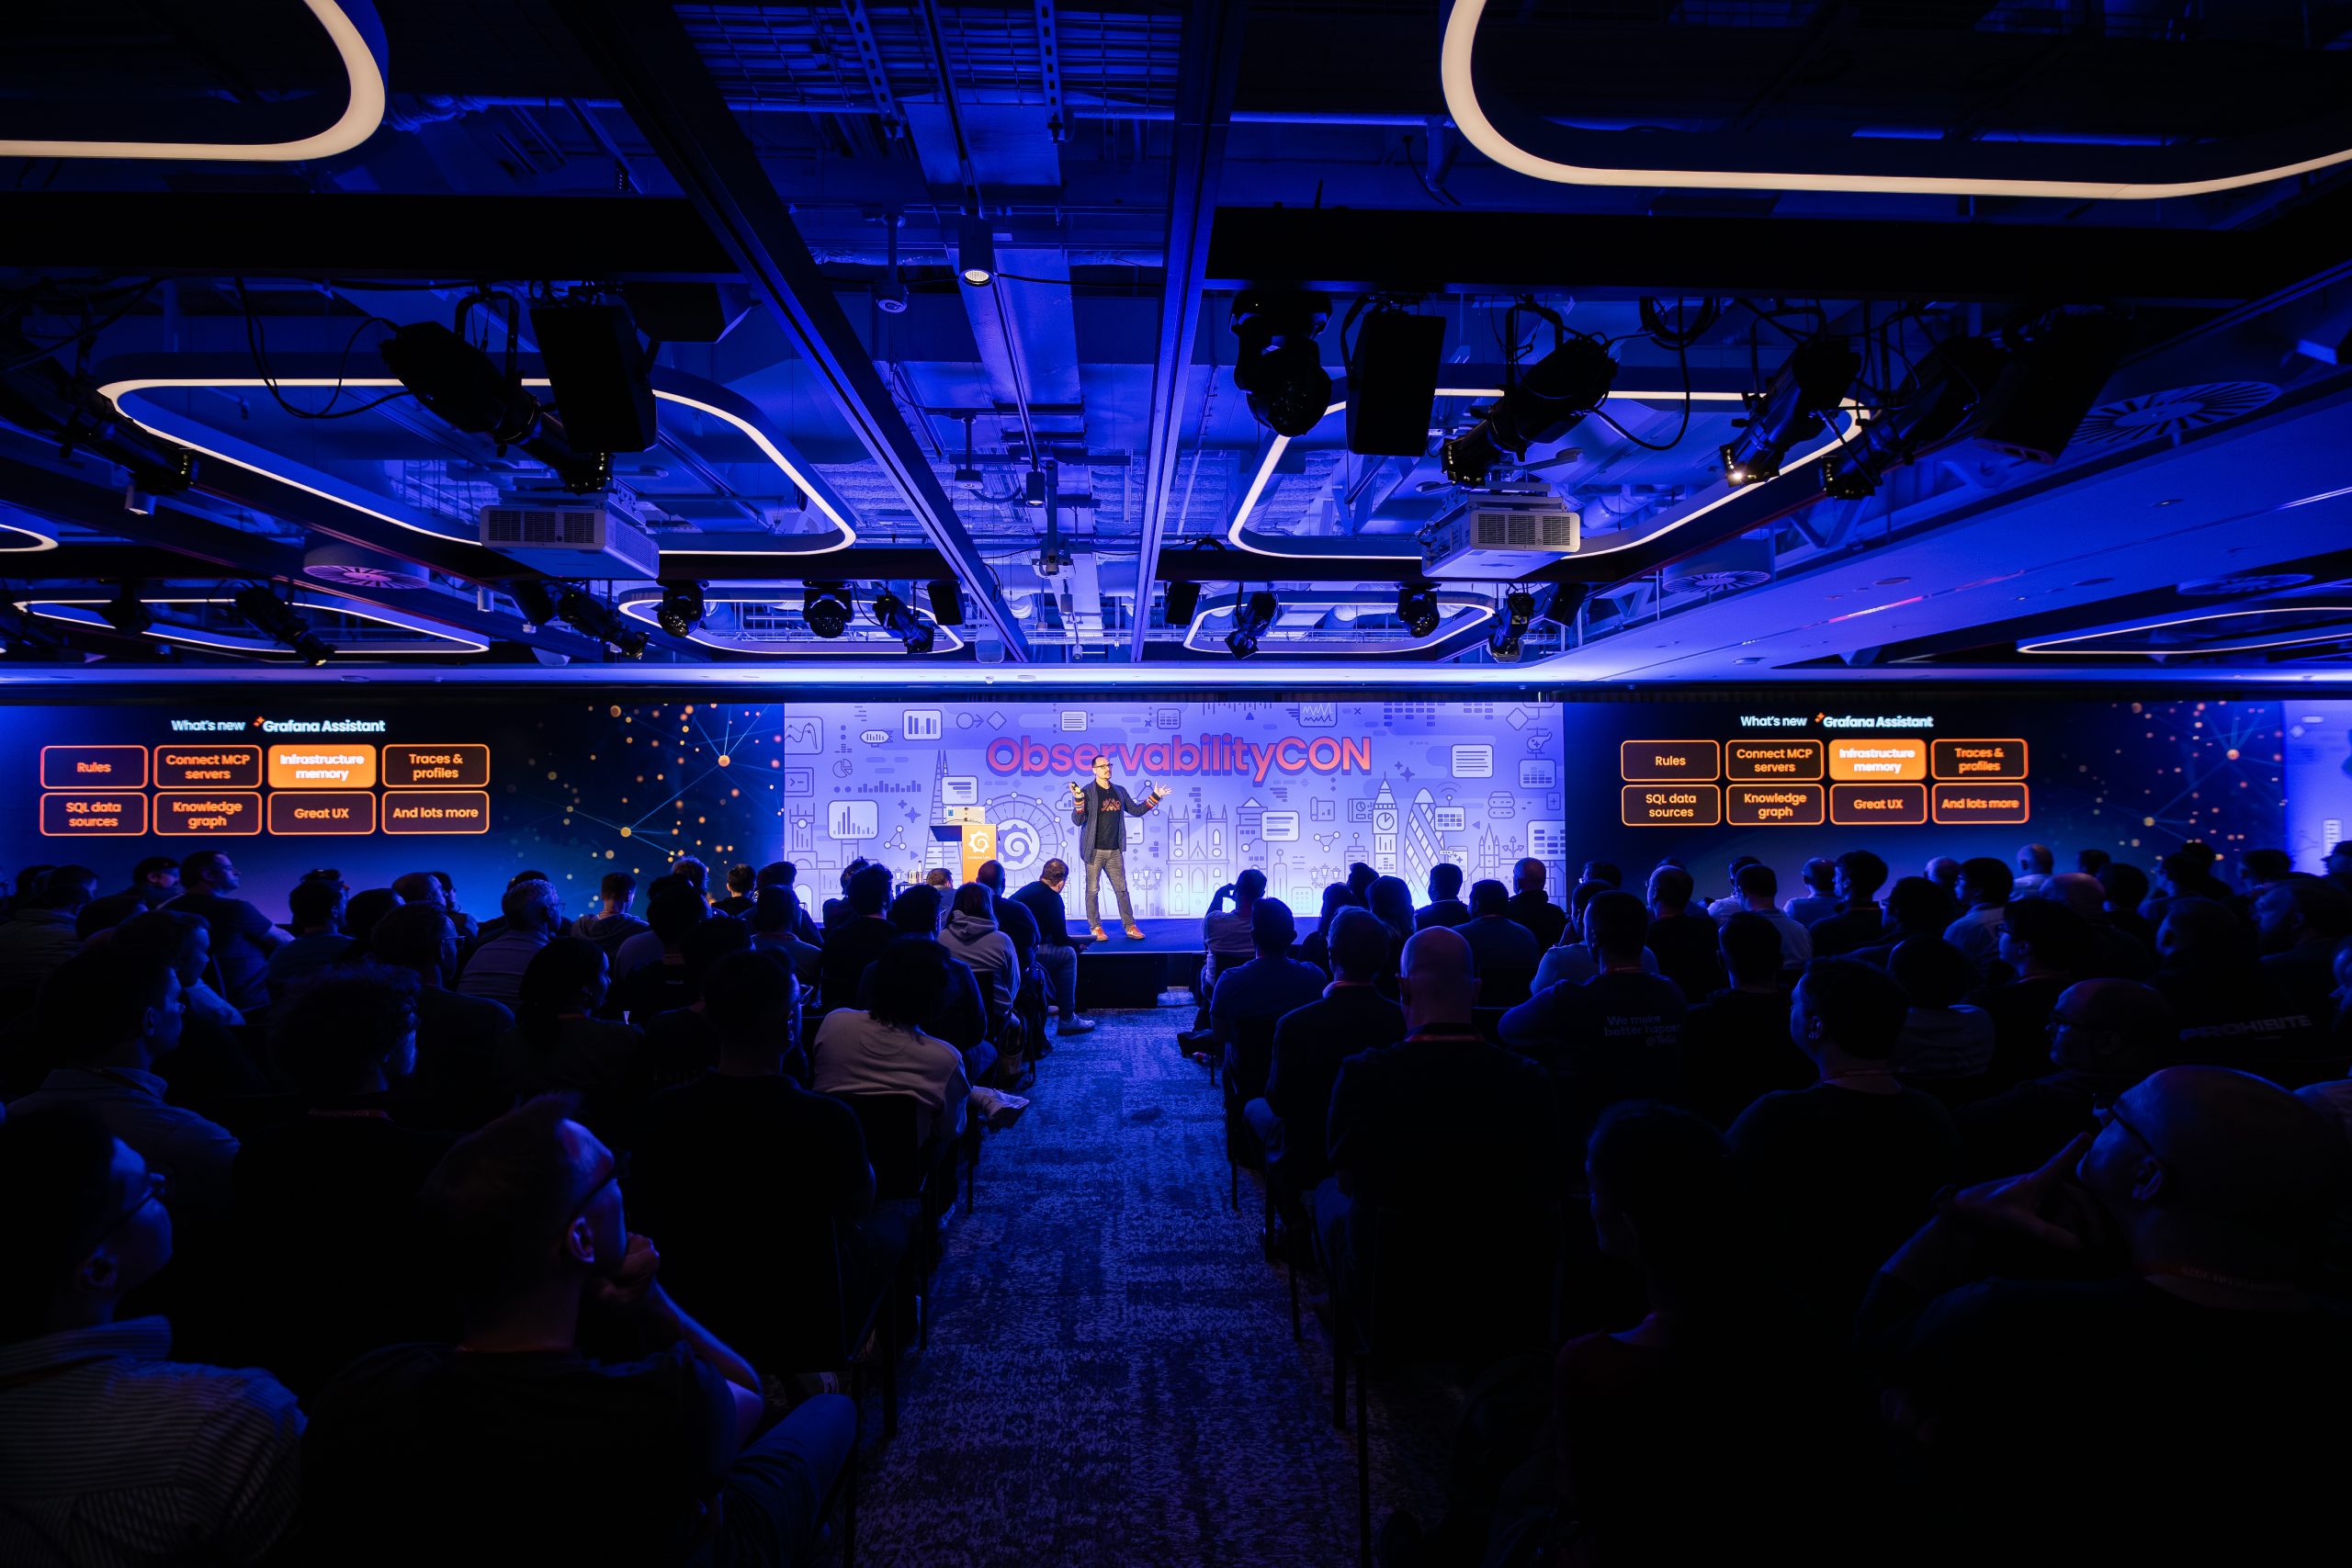
Grafana Assistant & Assistant Investigations
Grafana Assistant is now generally available as a context-aware AI agent embedded into Grafana Cloud. It can:
- Help write or debug queries (PromQL, LogQL, TraceQL) using natural language
- Suggest and optimize dashboards
- Surface anomalies and guide investigation
- Navigate Grafana via conversational commands
- Provide in-product guides, RBAC controls, and support for MCP servers via the LLM app
Grafana Labs also announced that their multi-step agentic AI, Assistant Investigations, is now available in public preview. This model utilises a team of specialized agents to automatically detect anomalous behaviour across telemetry data, construct a system-level view of the incident, and suggest mitigation or root cause paths — all within a guided workflow that is available to the user in natural language.
“Our customers are already telling us that they are already seeing a lot of value from this. It’s changing the way they work, and so we’re very excited about this.” ~ Dmitry Filimonov, Principal Engineer at Grafana Labs
With AI agents like Grafana Assistant and Assistant Investigations, observability is evolving from passive dashboards and alerts to a collaborative, conversational experience. Rather than requiring deep expertise to interpret signals, teams can query in natural language and get guided insights. This lowers the ramp for new engineers and helps reduce cognitive load and context switching.
Expansion of the Adaptive Telemetry suite
Grafana’s Adaptive Telemetry suite now expands beyond metrics and logs to include Adaptive Traces (generally available), and Adaptive Profiles (in private preview).
The evolution of Adaptive Telemetry — now extending to traces and profiling — means you no longer have to choose between visibility and control. Telemetry which is unlikely to yield value is dropped or down-sampled intelligently, while important anomalies are preserved.
- Adaptive Traces: Applies post-collection “tail sampling” to drop lower-value traces while preserving the ones likely to contain anomalies. You can define custom policies, integrate anomaly detection, and feed into Grafana’s trace drilldowns.
- Adaptive Profiles: Dynamically modulates continuous profiling rates based on workload behaviour, so you capture detailed insights under stress while throttling during stable periods.
Overall, Adaptive Telemetry addresses two of the core challenges within observability: cost and scale. Through the addition of Adaptive Traces and Profiles to their suite, Grafana remains focused on tackling these challenges, helping organisations to maintain meaningful observability into their data flows while keeping costs and unnecessary manual data analysis at a minimum.
This provides much-needed flexibility for software developers and engineers when looking into anomalies within a system, while preventing costs from escalating.
“Adaptive Telemetry is really useful for intervening when a developer makes a very well-intentioned but expensive decision to suddenly multiply their time series by 1000, for example, or does something that makes it very difficult to control costs.” ~ Andy Howden, Director of Engineering (Acting) at DeliveryHero, one of Grafana Labs’ customers
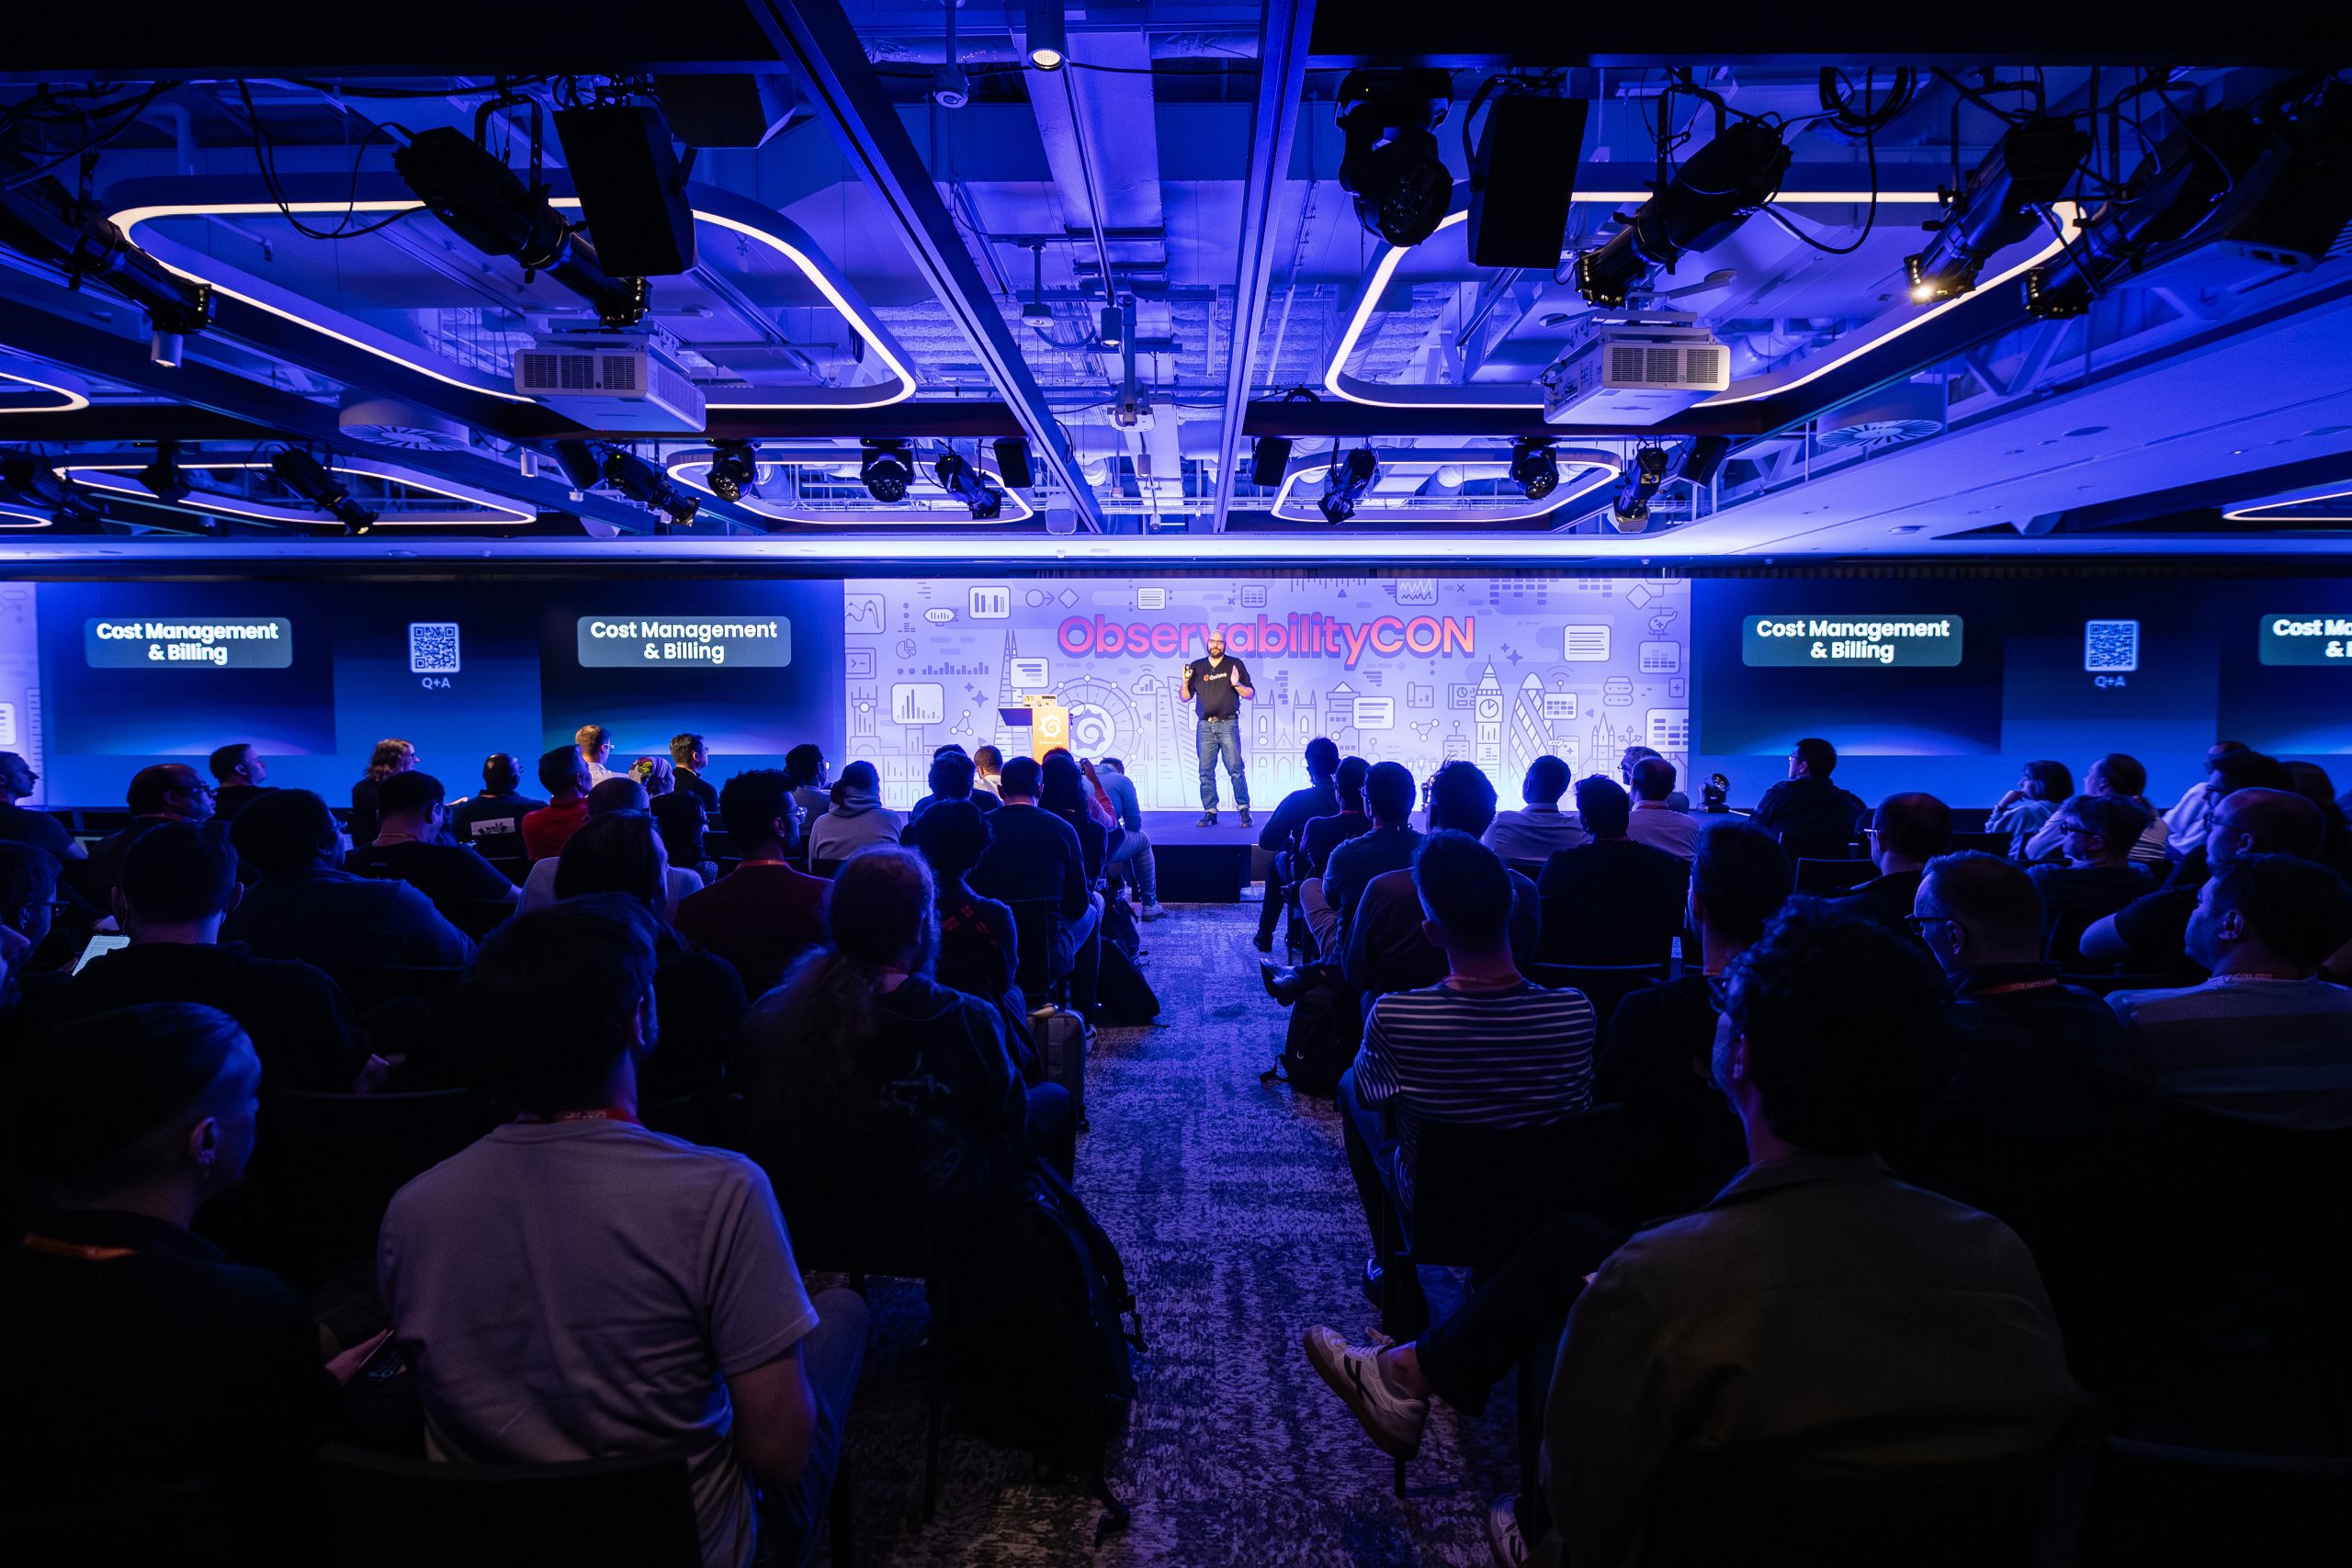
Cost Management through FOCUS
Grafana Cloud now includes an updated centralized Cost Management & Billing app, which consolidates usage, billing attribution, invoices, and proactive alerts. Under the hood it supports the FinOps Open Cost and Usage Specification (FOCUS), an open standard for cloud billing data.
This is done in three steps:
- Prevent: cost and usage signals are sent to controllers that you already trust, e.g. Slack, email, webbook of your choice, so that you can get alerts about your bill while there’s still time to act.
- Assign: the labels you already have are used to break down one big bill, slicing it by team and service.
- Unify: Every provider has a different billing language, and this fragmentation can cost teams hours to reconcile. With FOCUS, there’s just one schema that engineering and finance teams can use to get the same numbers, output to output, across all vendors.
This gives cloud operators better visibility and control over observability spend — a necessary tool as telemetry pipelines scale.
“Observability is usage based. This is both a strength and a risk. We don’t know usually know how much an incident is going to cost us until they happen, and by the time we do know, it’s too late and that money is already spent. If the first time you see a spike is on a billing statement, you’ve lost the most important thing you have: time to react.” ~ Rich Kreitz, Staff Product Manager at Grafana Labs
BYOC & Grafana Federal Cloud
- BYOC (Bring Your Own Cloud) enables customers to use their own cloud service provider accounts (e.g. AWS, Google), along with the discounts included, while benefiting from Grafana Cloud’s managed features.
- Grafana Federal Cloud is now generally available and authorized for FedRAMP High / DoD IL5, making Grafana’s managed observability platform viable for highly regulated U.S. government environments.
Features like secrets management, Federal Cloud compliance, and tighter IRM workflows show that Grafana is maturing from a developer-centric observability tool to an enterprise-grade platform. These capabilities are critical for organizations in regulated domains or those with high security expectations.
Together, BYOC and Grafana Federal Cloud show the adaptability of Grafana’s observability suite. Observability can be especially challenging for larger-scale organisations, but just as important.
By enabling customers to use Grafana’s products in their own cloud environments, Grafana is opening up observability to a wider user base.
“We designed and built Grafana Cloud to be really cost-effective even at scale. We’re now running 25 regions Grafana Cloud around the world, and our biggest regions run over a billion active series. But despite this, there’s ever bigger and bigger users of our technology. We wanted to find a solution for these users, where the traditional SaaS economics start to break down.” ~ Tom Wilkie, CTO at Grafana Labs
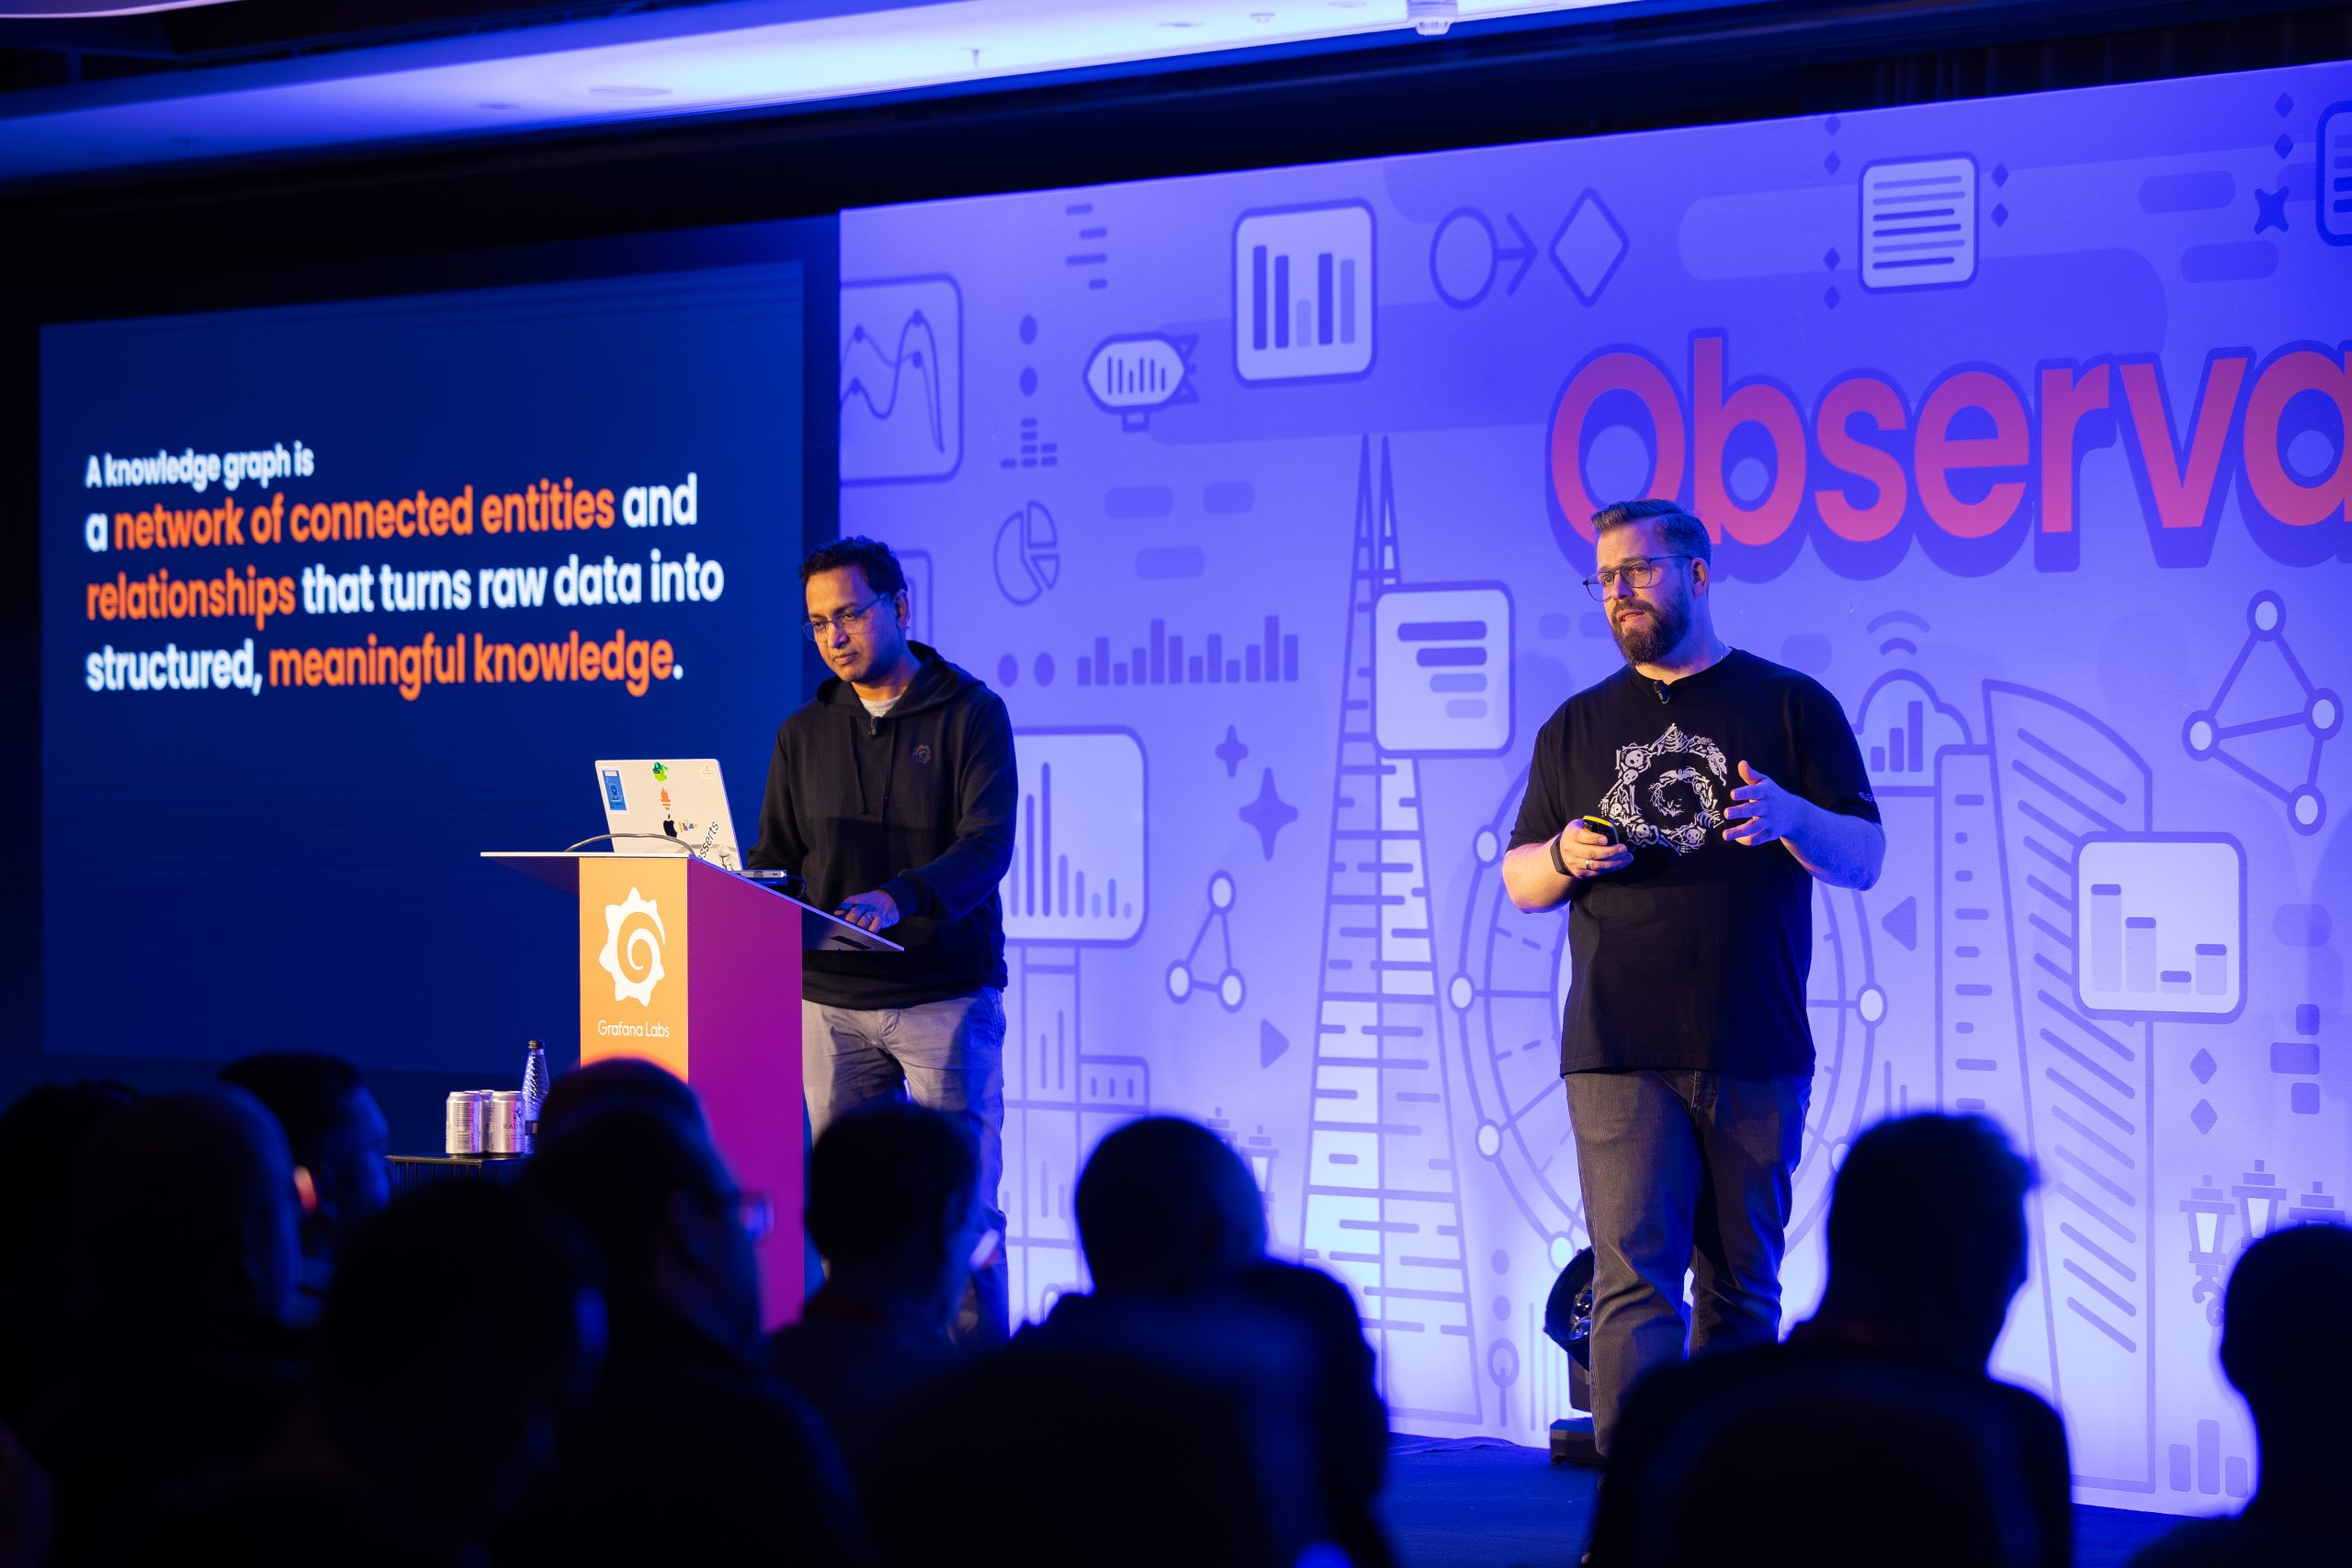
Full-Stack Observability via Knowledge Graph & Service Centre
Grafana Cloud’s Knowledge Graph (formerly ‘Asserts’) is now generally available. It links metrics, logs, traces, and profiles across application, infrastructure, and frontend domains, creating a unified graph of system components and dependencies.
- It surfaces intelligent workflows: auto-discovering services, visualizing dependencies, and offering curated dashboards
- It accelerates root cause analysis (RCA) by consolidating anomalies and events into a single view
- It integrates with Grafana Assistant to reduce the time spent in RCA war rooms to minutes instead of hours.
“We created a platform to integrate our open observability cloud solutions. The knowledge graph can show you a list of all the components of a system and their relationship to each other. These interdependencies are critical to many of your daily tasks.” ~ Myrle Krantz, Engineering Director at Grafana Labs
Service Center also gives teams an accessible view into their organisation’s operations, organizing all telemetry, alerts, incidents, and objects under logical service definitions rather than raw telemetry streams.
Its features include:
- Inventory of Grafana Cloud resources by service
- Operational review of dashboards (SLOs, alerting history, incident timelines)
- Ownership of metadata and historical metrics like MTTR (mean time to recovery), alert firing trends, and grouping by service owner
Taken together, the Service Centre and Knowledge graph demonstrate Grafana’s strongest capability for providing an integrated, ‘single pane view’ into an organisation’s data flow. This integrated view is key to diagnosing cascading failures, detecting cross-layer interactions, and understanding systemic resilience.
This is a key capability especially for management teams, since most systems today are deeply interconnected, involving microservices, databases, user-facing frontends, backend services, and infrastructure. The Knowledge Graph and Service Centre bring all these signals into a coherent model. That means you no longer troubleshoot in siloes (logs here, metrics there, traces elsewhere) — you can see the topology of your system, allowing you to reason holistically and plan for the future more effectively.
Database Observability & Instrumentation Hub
To close the visibility gap in database layers, and accelerate troubleshooting, Grafana is introducing Database Observability (now in public preview), which:
- Tracks query-level performance
- Quickly correlates queries with application and infrastructure signals
- Digs deep into execution plans, schema details, and index usage to expose inefficiencies
- Offers AI-powered optimization advice and runnable code suggestions
With Database Observability, Grafana is pushing visibility deeper so you can correlate query performance, schema issues, indexing, and execution plans with upstream application behaviour. This is a key advancement in closing the instrumentation gap between applications and raw data.
Also in the works is their Instrumentation Hub, which will help users discover instrumentation gaps and deploy auto-instrumentation at scale via a point-and-click UI.
“In the Instrumentation Hub, you can discover all the service spaces and clusters that are on your system and see them from Grafana Cloud. Then if you want to instrument them, you can do that with a single button push. The other really great thing about it is that you can also turn it off for parts of your system that you’re pulling data from but you’re not really using anymore.” ~ Myrle Krantz, Engineering Director at Grafana Labs
Overall, these features illustrate Grafana’s user-centric approach to database management, all designed for optimal efficiency and ease of use.
The Outlook: What These Features Mean for Users
For teams managing observability at scale today, Grafana’s latest updates offer several new levers:
- You can build more scalable pipelines by offloading “noise suppression” to Adaptive Telemetry, freeing engineers from manual sampling rules.
- You can lean on AI assistants to support newer team members, standardize investigation workflows, and reduce mean time to resolve.
- You can break down telemetry silos by aligning different services (via Service Centre) and different insights (via the Knowledge Graph).
- You can instrument deeper into databases and automatically spot rarely surfaced issues.
- You can better control cost, governance, and spend as observability becomes a first-class part of your cloud architecture.
With such a holistic and user-based view of observability reflected in their products, it’s no wonder that they were recognised as a leader in 2025 Gartner Magic Quadrant for Observability Platforms, ranked number one in this category for ‘completeness of vision’.
The company’s focus on automation and intelligent software in their latest innovations in Grafana Cloud also points to their broader vision for the future.
For Grafana, observability in today’s world is no longer means just ‘monitor, alert, and dashboard’. Instead, they are focusing on creating a proactive, intelligent system that supports diagnosis, governance, cost control, and shared understanding across teams.
In short, they are building products for today, but with tomorrow in mind.