Introduction
Consider maintaining and developing an e-commerce platform that processes millions of transactions every minute, generating large amounts of telemetry data, including metrics, logs, and traces across multiple microservices. When critical incidents occur, on-call engineers face the daunting task of sifting through an ocean of data to unravel relevant signals and insights. This is equivalent to searching for a needle in a haystack.
From my experience building large-scale distributed systems and observability platforms, I have noticed that engineers often spend the majority of their time correlating data and alerts that have been fired.
This makes observability a source of frustration rather than insight. To alleviate this major pain point, I started exploring a solution to utilize the Model Context Protocol to add context and draw inferences from the logs and distributed traces. In this article, I outline my experience building an AI-powered observability platform, explain the system architecture, and share actionable insights learned in the process.
Why Is Observability Challenging?
In modern software systems, observability is not a luxury; it’s a basic necessity. The ability to measure and understand system behavior is foundational to reliability, performance, and user trust. As the saying goes, “What you cannot measure, you cannot improve.”
Yet, achieving observability in today’s cloud-native, microservice-based architectures is harder than ever. A single user request may traverse dozens of microservices, each emitting logs, metrics, and traces. The result is an abundance of telemetry data:
- Tens of terabytes of logs per day
- Tens of millions of metric data points and pre-aggregates
- Millions of distributed traces
- Thousands of correlation IDs generated every minute
The challenge is not only the data volume but also the data fragmentation. According to the New Relic’s 2023 Observability Forecast Report, 50% of organizations report siloed telemetry data, with only 33% achieving a unified view across metrics, logs, and traces.
Logs tell one part of the story, metrics another, and traces yet another. Without a consistent thread of context, engineers are forced into manual correlation, relying on intuition, tribal knowledge, and tedious detective work during incidents.
Poor observability doesn’t just slow down debugging; it erodes team confidence, increases alert fatigue, and delays recovery. In systems where every second of downtime costs money or customer trust, the stakes are too high.
Because of this complexity, I started to wonder: How can AI help us get past fragmented data and offer comprehensive, useful insights? Specifically, can we make telemetry data intrinsically more meaningful and accessible for both humans and machines using a structured protocol such as the Model Context Protocol (MCP)? This project’s foundation was shaped by that central question.
Understanding Model Context Protocol: A Data Pipeline Perspective
Anthropic defines the Model Context Protocol (MCP) as an open standard that allows developers to create a secure two-way connection between data sources and AI tools. If we consider MCP as a structured data pipeline designed specifically for AI,
- Contextual ETL for AI: Standardizing context extraction from multiple data sources.
- Structured Query Interface: This allows AI queries to access data layers that are transparent and easily understandable.
- Semantic data enrichment: This entails embedding meaningful context directly into telemetry signals.
This has the potential to shift platform observability away from reactive problem solving and toward proactive insights.
System Architecture and Data Flow
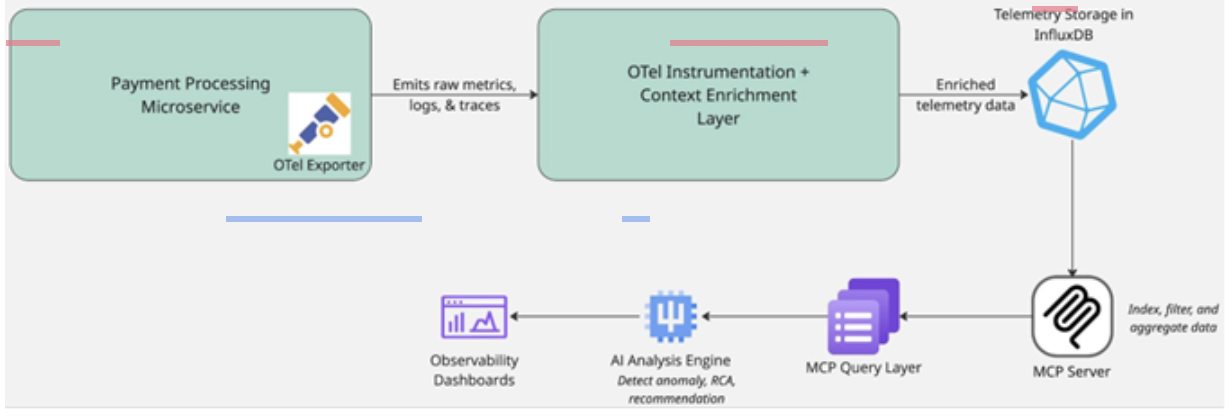
Before diving into the implementation details, let’s walk through the system architecture.
Figure 1. Architecture diagram for the MCP based AI observability system
In the first layer, we develop the contextual telemetry data by embedding standardized metadata in the telemetry signals, such as distributed traces, logs, and metrics. Once that is complete, in the second layer, enriched data is fed into the MCP server to index, add structure, and provide client access to the context-enriched data using APIs. Finally, the AI-driven analysis engine utilizes the structured and enriched telemetry data for anomaly detection, correlation, and root-cause analysis to troubleshoot application issues.
This layered design ensures that AI and engineering teams receive context-driven, actionable insights from telemetry data.
Implementative Deep Dive: A Three-Layer System
Let’s explore the actual implementation of our MCP-powered observability platform, focusing on the data flows and transformations at each step.
Layer 1: Context-Enriched Data Generation
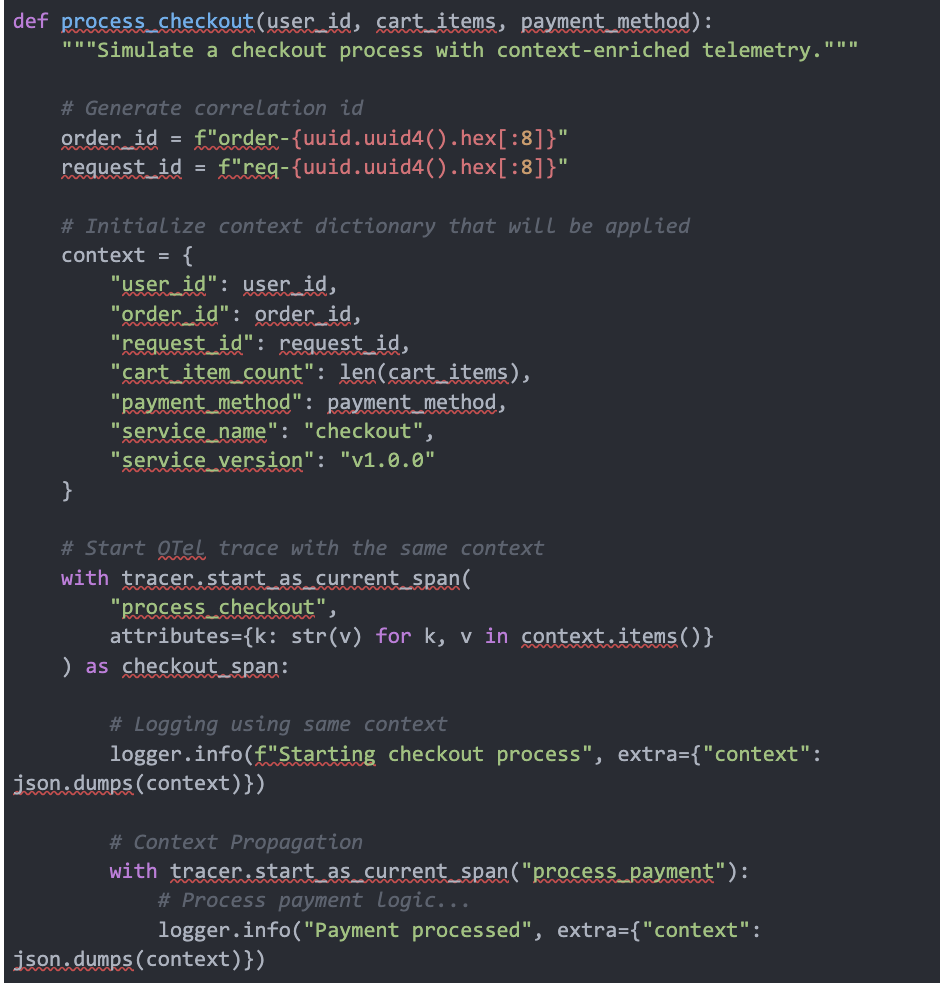
First, we need to ensure our telemetry data contains enough context for meaningful analysis. The core insight is that data correlation needs to happen at creation time, not analysis time.
Code 1. Context enrichment for logs and traces
This approach ensures that every telemetry signal (logs, metrics, traces) contains the same core contextual data, solving the correlation problem at the source.
Layer 2: Data Access Through MCP Server
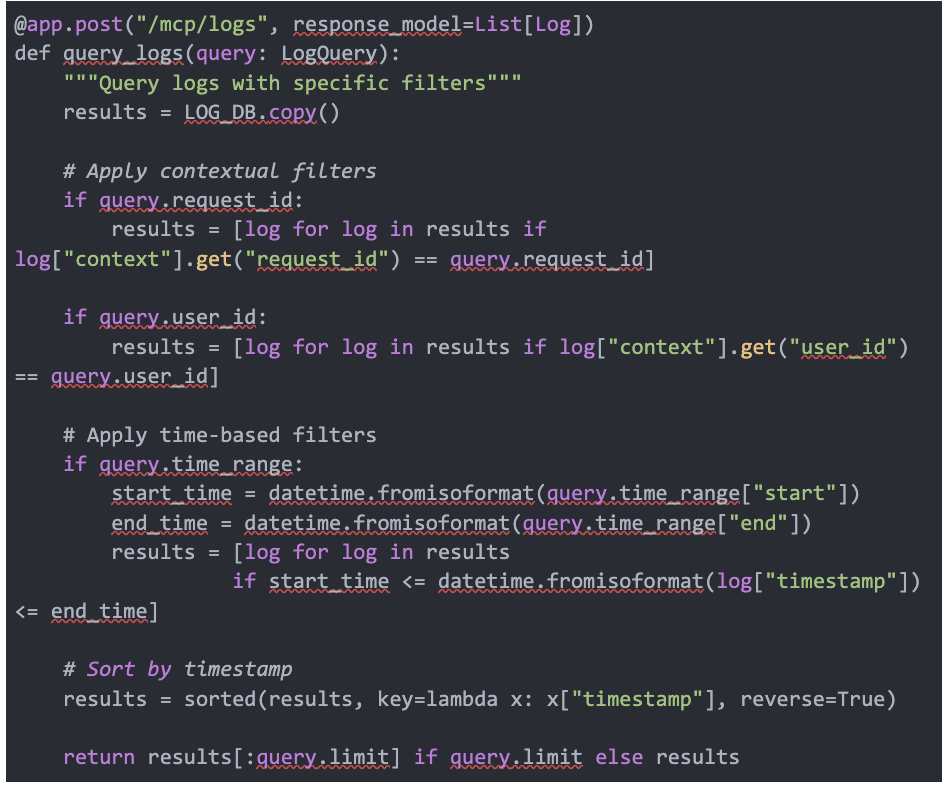
Next, I built an MCP server that transforms raw telemetry into a queryable API. The core data operations here involve the following:
- Indexing: Creating efficient lookups across contextual fields
- Filtering: Selecting relevant subsets of telemetry data
- Aggregation: Computing statistical measures across time windows
Code 2. Data transformation using the MCP server
This layer transforms our telemetry from an unstructured data lake into a structured, query-optimized interface that an AI system can efficiently navigate.
Layer 3: AI-Driven Analysis Engine
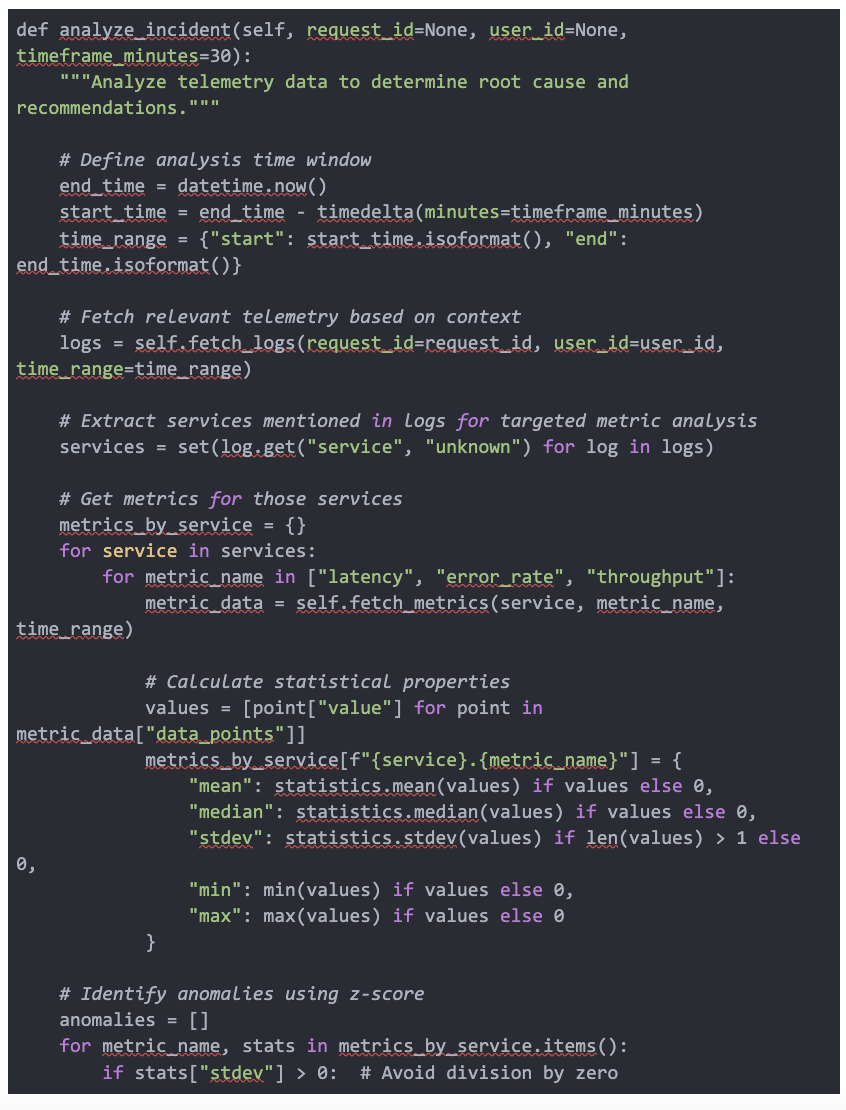
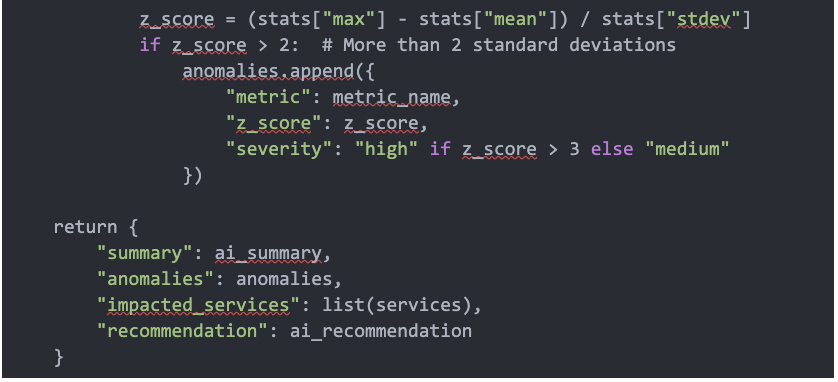
The final layer is an AI component that consumes data through the MCP interface, performing
- Multi-dimensional analysis – Correlating signals across logs, metrics, and traces
- Anomaly detection – Identifying statistical deviations from normal patterns
- Root cause determination – Using contextual clues to isolate likely sources of issues
Code 3. Incident analysis, anomaly detection, and inferencing method
Impact of MCP-Enhanced Observability
Integrating MCP with observability platforms could improve the management and comprehension of complex telemetry data. The potential benefits include:
- Embedding the context early in the telemetry data ensures faster anomaly detection, resulting in reduced Minimum Time to Detect (MTTD) and Minimum Time to Resolve (MTTR).
- This 3-layered approach for generating structured telemetry makes it easier to identify root causes for issues.
- The context-rich telemetry with correlation allows on-call engineers to deal with less noise and fewer unactionable alerts. Thus, reducing alert fatigue and improving developer productivity.
- Overall, this results in fewer interruptions and context switches during incident resolution, resulting in improved operational efficiency for an engineering team.
Actionable Insights
Here are some key insights from this project that will help teams with their observability strategy.
- Contextual metadata should be embedded early in the telemetry generation process to facilitate downstream correlation.
- Structured data interfaces create API-driven, structured query layers to make telemetry more accessible.
- Context-aware AI focuses analyses on context-rich data to improve accuracy and relevance.
- Refine context enrichment and AI methods on a regular basis using practical operational feedback.
Conclusion
The amalgamation of structured data pipelines and AI holds enormous promise for observability. We can transform vast telemetry data into actionable insights by leveraging structured protocols such as MCP and AI-driven analyses, resulting in proactive rather than reactive systems. The 2023 report from Lumigo states the three pillars of observability – logs, metrics, and traces – are essential, but without integration, engineers are forced to manually correlate disparate data sources, slowing incident response.
The key insight is that the observability problem is fundamentally a data problem.
It requires structural changes to how we generate telemetry as well as analytical techniques to extract meaning from it.

